Quantitative KPIs: Measuring Your Performance (The Diagnosis)
The 4 Non-Negotiable Sales KPIs
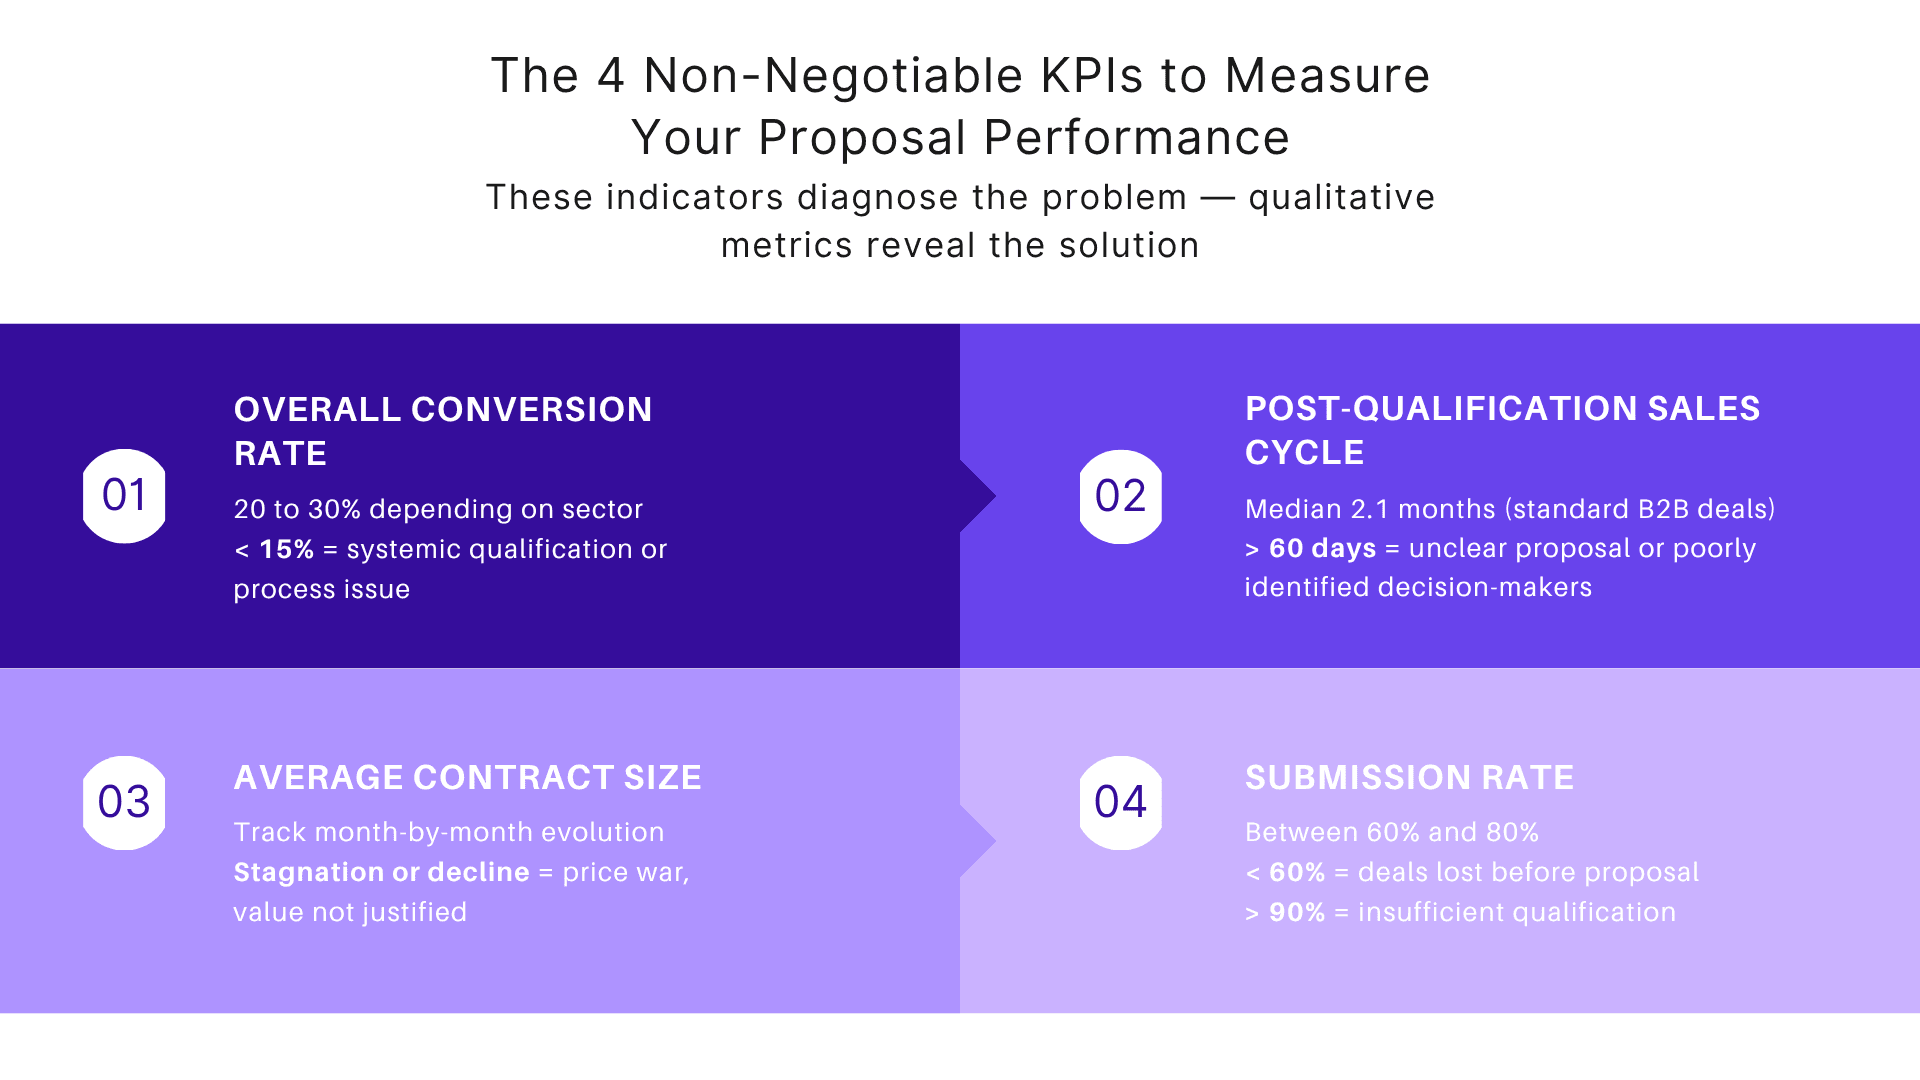
The bare minimum to diagnose your proposal performance exists. Four indicators are enough to know where you stand.
- Overall Conversion Rate
The percentage of sent proposals that close. This is your master indicator.
B2B Benchmark: Between 20% and 30% depending on sources. In B2B, the average rate sits around 20%, with significant sector variations. B2B SaaS shows approximately 27% closing on SQLs (Sales Qualified Leads), according to recent industry studies. A rate below 15% reveals a systemic problem—either in your qualification or in your proposal process itself.
Simple calculation: (Number of signed deals / Number of proposals sent) × 100
What it reveals: A low rate is NEVER an isolated proposal problem. It's ALWAYS a symptom of a failing upstream process. If you're closing less than 20%, the problem likely lies in your discovery phase or qualification.
- Post-Qualification Sales Cycle Duration
The time between sending the proposal and contract signature.
Benchmark: Research shows that 75% of B2B sales to new customers take at least 4 months, and nearly half (46%) take 7 months or more, according to CSO Insights. However, these figures include the entire cycle. For the post-qualification phase specifically, cycles shorten considerably. Databox indicates a median of 2.1 months for typical B2B deals.
What it reveals: A lengthening cycle indicates vague proposals or insufficient qualification. If your prospects take more than 60 days to decide after receiving your proposal, they're still looking for answers you should have provided.
- Average Contract Size
The average amount of won deals. This indicator reveals whether your proposals effectively justify your value.
Direct correlation: Structured proposals that clearly articulate ROI enable higher prices. A B2B study shows that companies with $1,430 average desktop cart values perform significantly better than those who don't articulate their value (Contentsquare, 2022).
To track: Month-over-month evolution. An increasing average size indicates your proposals create perceived value. A stagnating or declining size reveals price wars—a sign you're not sufficiently justifying your differentiation.
- Submission Rate
The percentage of qualified opportunities that result in a sent proposal.
Optimal benchmark: Between 60% and 80%. Too low (<60%) reveals either a qualification problem (you're losing deals before even proposing) or team reluctance to invest necessary time. Too high (>90%) indicates insufficient qualification—you're proposing to everyone indiscriminately.
Trap to avoid: These KPIs diagnose but don't explain. A low closing rate can have 10 different causes. A long cycle might come from deal complexity, a vague proposal, or a misunderstood decision process. That's where qualitative analysis comes in.
The Calculable ROI of Proposal Improvement
Transforming performance gains into concrete revenue impact is possible with a simple formula.
The formula:
Improved closing rate × Number of proposals/year × Average deal size = Annual revenue gain
Concrete example:
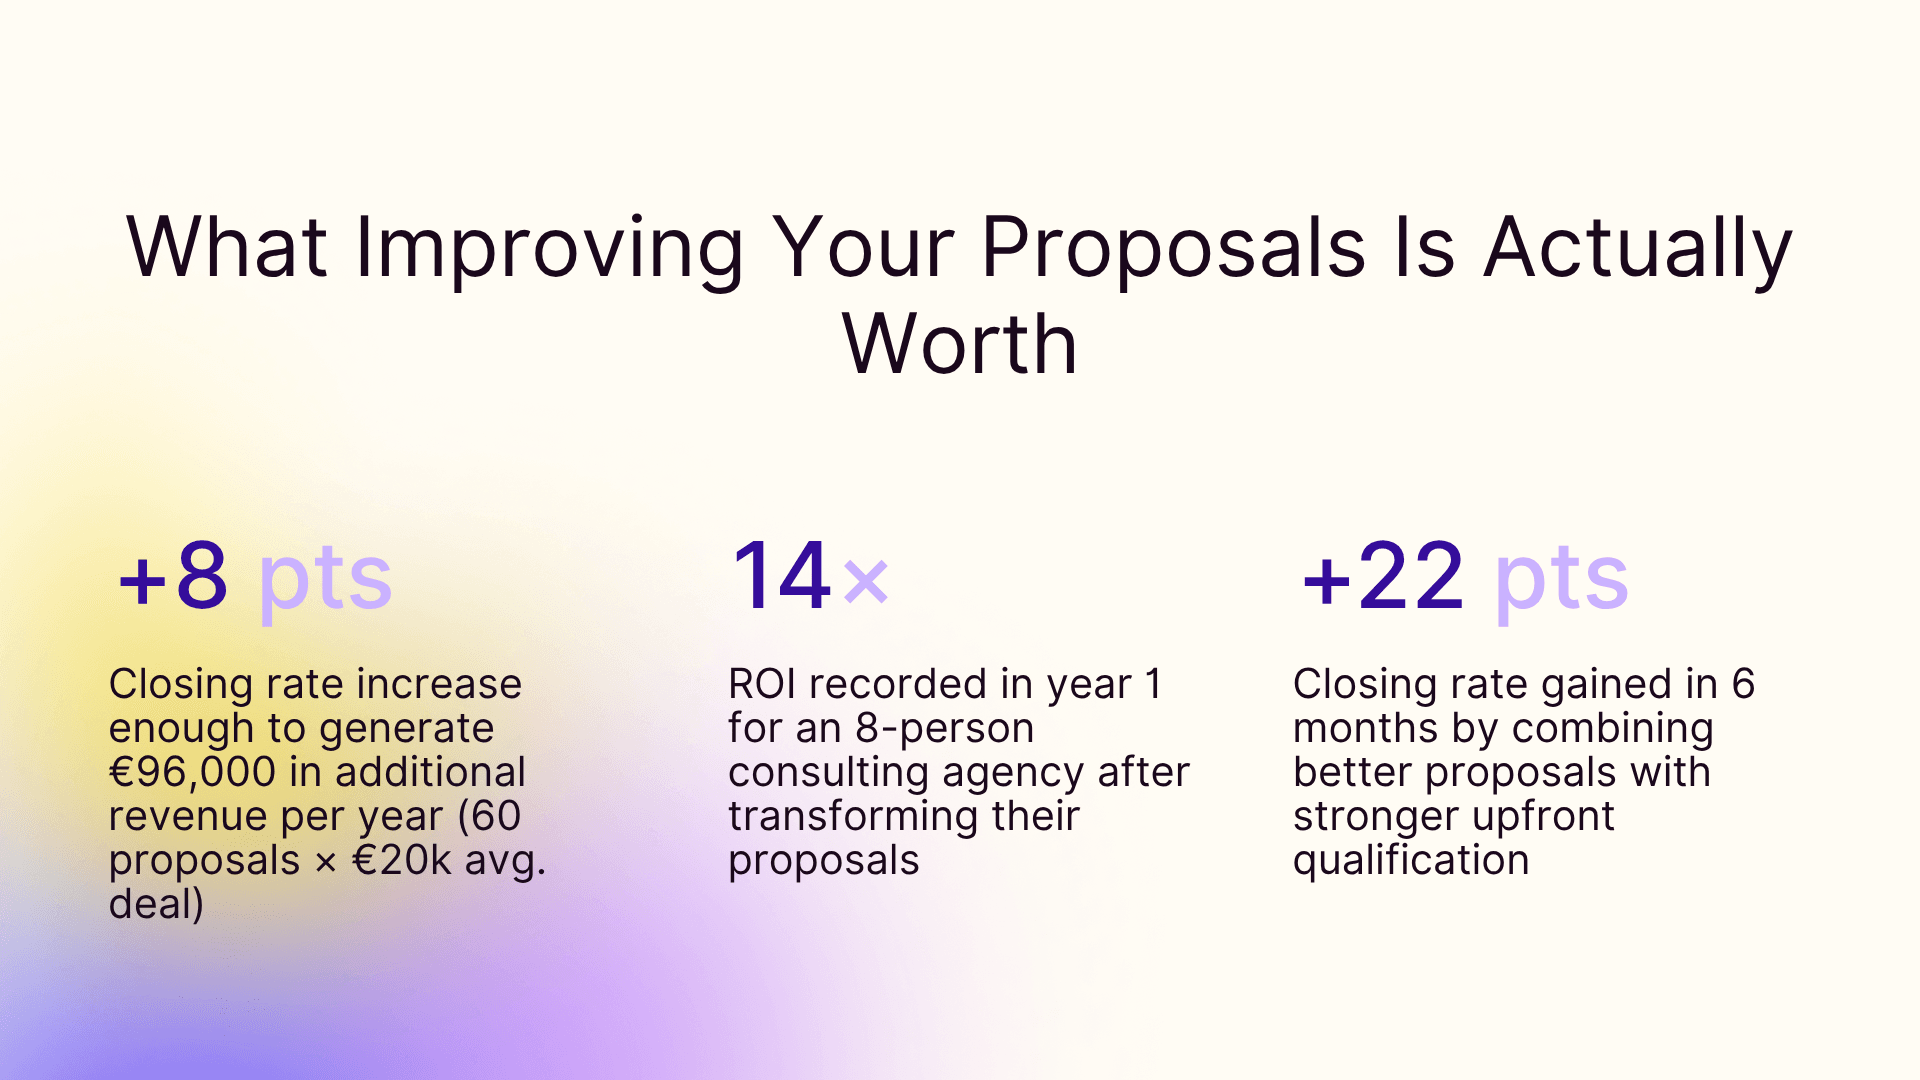
+8 closing points × 60 proposals/year × $20,000 average deal = +$96,000 additional revenue
Real case: 8-person consulting agency (1 salesperson + 7 consultants, $800k revenue with $150k new business target annually)
- Before: 22% closing on new business
- After proposal structuring: 30% closing
- New business impact: +$12k monthly revenue = +$144k annually
- Overall impact: Revenue grows from $800k to $944k (+18%)
- Transformation cost: Training + tools < $10k
- ROI: 14× in year 1
Key point: Even a "modest" 5-point closing gain often represents the equivalent of 6 months of a salesperson's salary in additional revenue. This isn't a marginal gain—it's a massive growth lever.
Qualitative Metrics: Understanding the "Why" (The Transformation)
Discovery Quality: The Most Powerful Predictive KPI
Your discovery phase quality predicts your closing rate better than any other variable. Better than your price. Better than your brand awareness. Better than your proposal design.
How to measure concretely?
Method 1: Discovery Completeness Score (0-100)
Checklist of 4 essential categories to document:
- Client context (current situation, history, constraints)
- Identified needs (quantified problems, business impacts)
- Decision process (stakeholders, timeline, criteria, validated budget)
- Project expectations (measurable objectives, success definition)
Minimum acceptable score: 70/100
Observed correlation: A score above 80 doubles your closing rate compared to a score below 60.
Method 2: "Context & Challenges" Section Analysis
Simple test: can a colleague outside the deal identify the client by reading your "Context & Challenges" section without seeing the company name?
- Generic/empty section: Failed discovery. You copy-pasted.
- Section with specific data: Solid discovery. The client recognizes themselves.
Insight: Impossible to write an excellent "Context" section without excellent discovery work. The rigor on proposal quality forces upstream process improvement.
Prospect Engagement: Viewing Patterns and Signals
How your prospect interacts with your proposal reveals their real level of interest and silent objections. Tracking becomes your sales intelligence tool here.
Tracking metrics to analyze:
- Time Spent Per Section
"Excellent discovery" pattern:
- Little time on "Context & Challenges" (they recognize themselves immediately)
- Lots of time on "Solution" and "Methodology" (they're projecting into implementation)
- Quick but attentive review
"Weak discovery" pattern:
- Multiple rereads of "Context & Challenges" (they're looking for connection to their reality)
- Quick abandonment after this section (you've lost their trust)
- Abnormally long time without advancing through document
- Number of Views and Timing
- 1 quick read then silence: Bad sign. The prospect isn't convinced.
- 2-3 spaced reads + internal sharing: Very good sign. They're mulling over their decision and convincing colleagues.
- Reread 48h after sending the Pricing section: Probable price objection. Ideal moment for targeted follow-up on ROI justification.
- Internal Sharing Rate
- Proposal shared with 3+ people: Active internal champion. Your deal is advancing.
- No sharing after 5 days: Prospect not convinced or not really the decision-maker.
Tactical exploitation: These signals enable relevant follow-ups. Instead of "I saw you viewed the methodology" (creepy), use these insights to personalize your approach: "Following our last discussion about the deployment phase, I have some clarifications that might be useful." Tracking gives you timing and subject—you stay natural in approach.
Actionable KPI: Percentage of deals with silent objections detected BEFORE they definitively block. Target: >60%.
Cuevr measures quality—not just the quantity—of your proposals
Beyond your conversion rate, measure what truly matters: qualification completeness score and proposal quality score. These qualitative KPIs predict your results and reveal where to improve.
- Qualification score to assess the strength of your discovery phase
- Proposal score evaluating each section individually
- Correlation between scores and closing rate to pinpoint growth levers
From Dashboard to Continuous Improvement: The Method
Building Your Management Dashboard
An effective dashboard answers 3 questions: Where are we? Where's it stuck? What to improve first?
3-level structure:
Level 1 - Overall Health (CEO view)
- Monthly conversion rate (curve + industry benchmark)
- Revenue generated by proposals vs target
- Average contract size evolution
Level 2 - Performance Diagnosis (Manager view)
- Conversion rate by salesperson (identify top/bottom performers)
- Average discovery quality score by salesperson
- Post-qualification cycle duration by deal type
Level 3 - Action Levers (Operational view)
- Top 3 weakest proposal sections (AI scoring)
- Lost deals: recurring categorized reasons
- Viewing patterns of won vs lost deals
Practical tool: A simple Google Sheets table is enough at startup. The selection criterion isn't sophistication—it's actual usage. If you don't look at it weekly, it's too complex.
Failure Analysis: The Gold Mine Nobody Exploits
Lost deals contain more lessons than won deals. Yet 95% of sales teams never systematically analyze them.
Systematic method:
- Mandatory debrief of each lost deal >$10k
Key questions to document:
- Which proposal section blocked?
- What didn't we understand about client context?
- What should we have asked during discovery?
- Did the prospect have budget? Timing? Authority?
- Categorization of Loss Reasons
- Price (but dig deeper: unjustified price = value creation problem, not pricing)
- Unsuitable solution (= failed upstream qualification)
- Timing (= misunderstood decision process)
- Competition (= insufficient differentiation)
- Monthly Pattern Spotting
Analyze your month's losses. If 60% are categorized "price," the problem is NOT price. It's your ability to justify value. If multiple losses block on the "Methodology" section, you have a recurring clarity problem on your process.
Case study: A marketing agency systematized this analysis for 3 months. Finding: 70% of losses attributed to "price" actually came from insufficient value demonstration across the proposal. They reworked their proposals to better articulate business benefits, expected ROI, and differentiation. Result: +12 closing points in 4 months through proposal improvement. 10 additional points came from better upstream qualification: they learned to eliminate prospects without real budget earlier. Total: +22 closing points in 6 months.
Drive your team’s performance with actionable dashboards
Get a clear view of the KPIs that matter: conversion rates per rep, average qualification scores, and prospect engagement. Instantly spot who needs coaching — and on what.
- Manager dashboards with a consolidated view of team performance
- Comparative analysis: who’s performing and who needs coaching
- Correlation between proposal quality and business outcomes
Measurement as Starting Point, Not Objective
Quantitative KPIs tell you WHERE you are. Qualitative metrics tell you WHY and HOW to progress. Most sales teams simply count their wins and losses. High-performing teams analyze the why and transform these insights into continuous improvement.
Progressive call-to-action:
Week 1: Track the 4 basic quantitative KPIs (conversion, cycle, average deal size, submission)
Week 2: Audit discovery quality of your last 5 proposals with the 0-100 score
Week 3: Analyze your last 3 lost deals with the categorization method
Week 4: Build your simple dashboard (1-page Google Sheets)
Closing message: Continuous improvement isn't optional in sales—it's the only way to stay performing. Measurement is the starting point, not the objective. The objective is to close more, better, faster.
Teams that automate this measurement—automatic discovery scoring, prospect engagement tracking, performance analytics—save 8-12 hours monthly on analysis. Most importantly, they decide based on facts, not intuitions. It's this virtuous circle we've built into Cuevr: a system that measures, diagnoses, and continuously improves.
Frequently Asked Questions
What are the essential KPIs to track for my sales proposals?
The 4 fundamental KPIs are: overall conversion rate (how many proposals close), post-qualification cycle duration (time between sending and signing), average contract size (average amount), and submission rate (% of opportunities that become proposals). These indicators diagnose your performance. But don't stop there: add qualitative metrics like discovery quality score and prospect engagement patterns to understand the "why" behind the numbers.
How do I calculate the ROI of improving my sales proposals?
Simple formula: (Improved closing rate) × (Number of proposals/year) × (Average deal size) = Annual revenue gain. Example: +8 closing points × 60 proposals × $20k = +$96k additional revenue. Compare this gain to your investment (training + tools, typically <$10k) to get your ROI. In most cases, ROI exceeds 10× in year one. This isn't a gadget—it's a direct growth lever.
What's the difference between quantitative KPIs and qualitative metrics in B2B sales?
Quantitative KPIs (closing rate, sales cycle, average deal size) tell you WHERE you are. They diagnose. Qualitative metrics (discovery quality, prospect engagement, analyzed viewed sections) tell you WHY you're there and HOW to progress. They explain and transform. 90% of teams only track quantitative and stagnate. The top-performing 10% leverage both for continuous improvement.