Competitive Mapping Fundamentals
Definition and principles of perceptual maps
A perceptual map represents a comparative analysis tool in the form of a two-axis chart. This visual representation allows evaluating a brand or product's position according to specific criteria like price and perceived quality. It’s an essential component of any competitive analysis, helping teams visualize their true differentiation potential.
The strength of this method lies in its ability to transform complex marketing data into actionable insights. For example, in the B2B software sector, a map can reveal market opportunities by comparing customization levels and ease of use across solutions.
Perceptual maps facilitate strategic decision-making by offering a comprehensive view of competitive clusters and potential differentiation zones. This methodical approach guides sales teams toward distinctive and relevant positioning.
Essential criteria for positioning analysis
Choosing evaluation criteria determines the relevance of your competitive analysis. Selection relies on measurable indicators like customer satisfaction, added value, or technological innovation.
In the B2B sector, effective mapping often combines a quantitative criterion (price, revenue) with a qualitative criterion (technical expertise, service level). Take the example of a software publisher that might cross-reference automation degree with customer support level.
Your positioning success relies on criteria aligned with your target clientele's expectations. A cloud solutions provider might, for example, evaluate offering flexibility and infrastructure robustness.
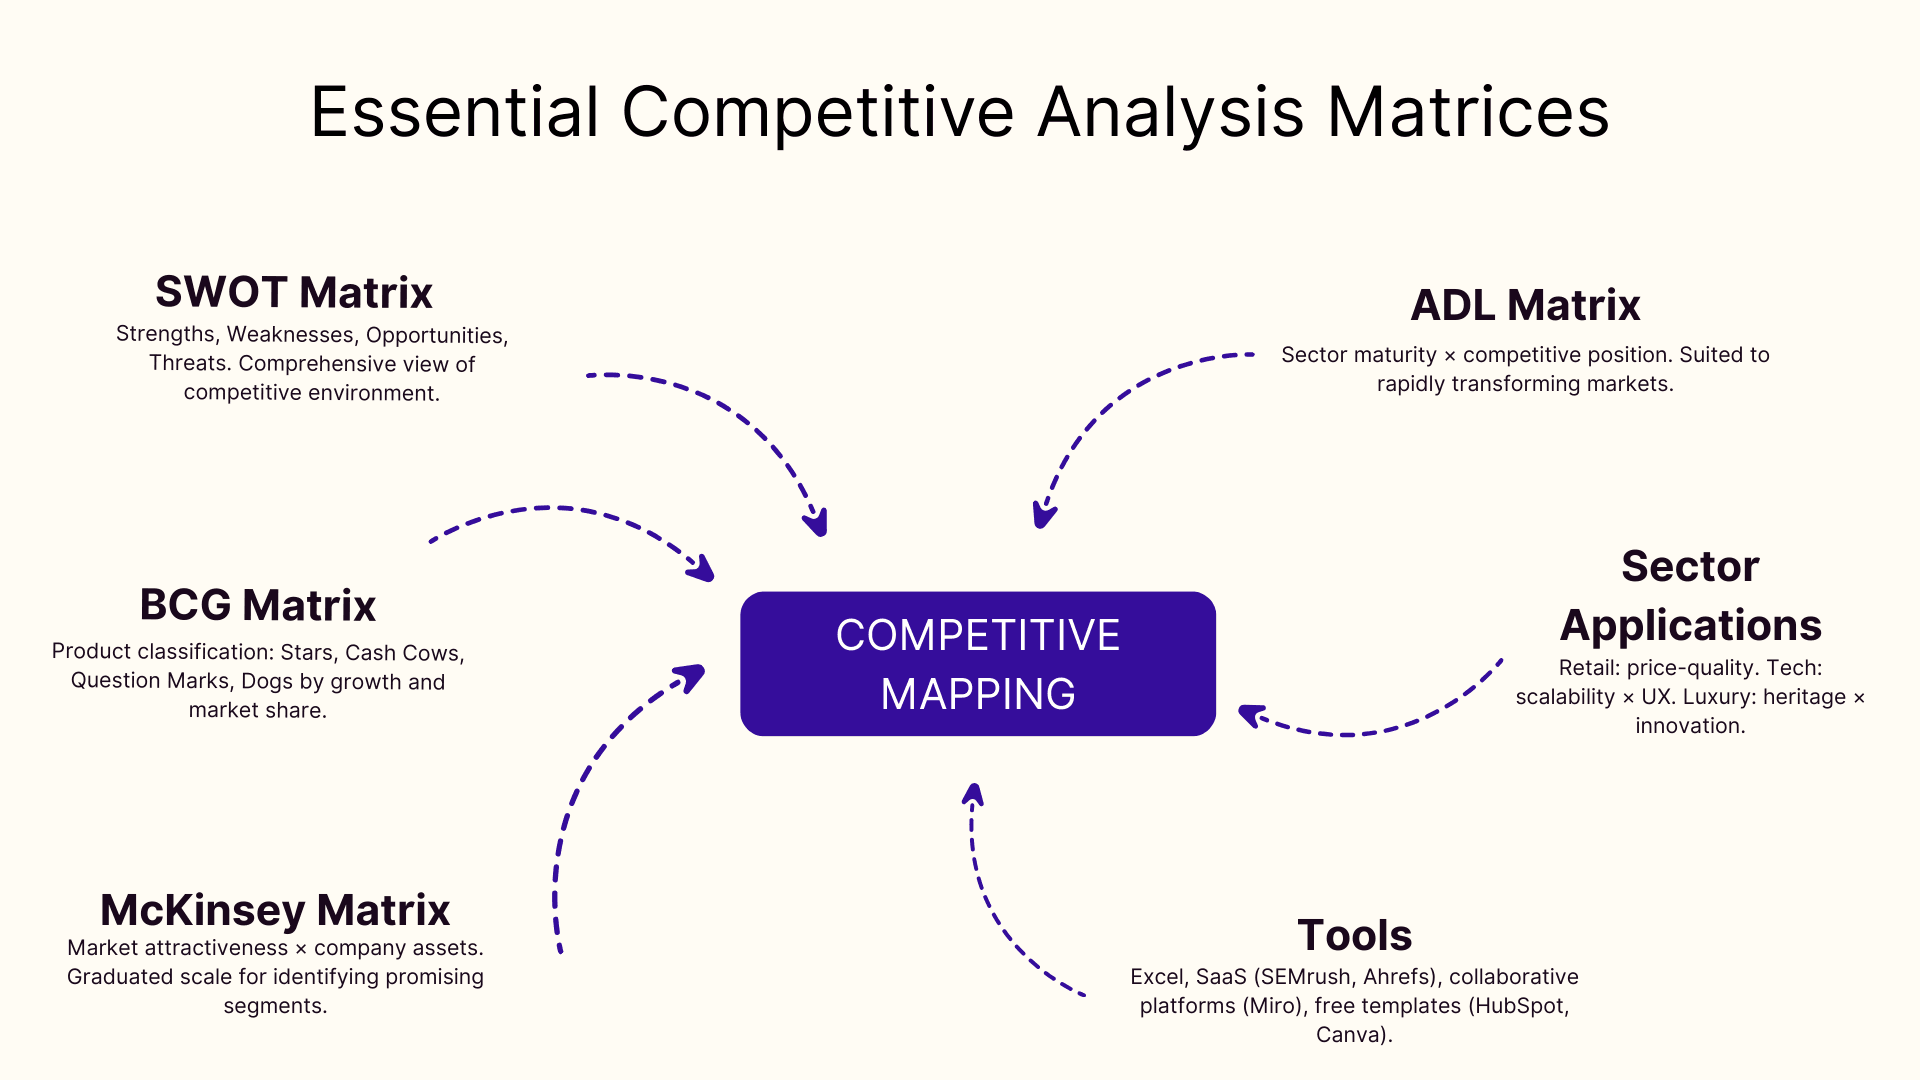
Different types of competitive matrices
The SWOT matrix represents the fundamental tool for evaluating your market position by comparing strengths, weaknesses, opportunities, and threats. For more precise analysis, BCG classifies your products according to their growth and relative market share.
The McKinsey matrix refines this approach by evaluating market attractiveness and company assets on a more nuanced scale. An industrial machinery manufacturer could, for example, use this grid to identify its most promising segments.
ADL and Arthur D. Little matrices bring an additional dimension by integrating sector maturity and competitive position. This method proves particularly suited to rapidly transforming markets.
Methodology for Creating Your Mapping
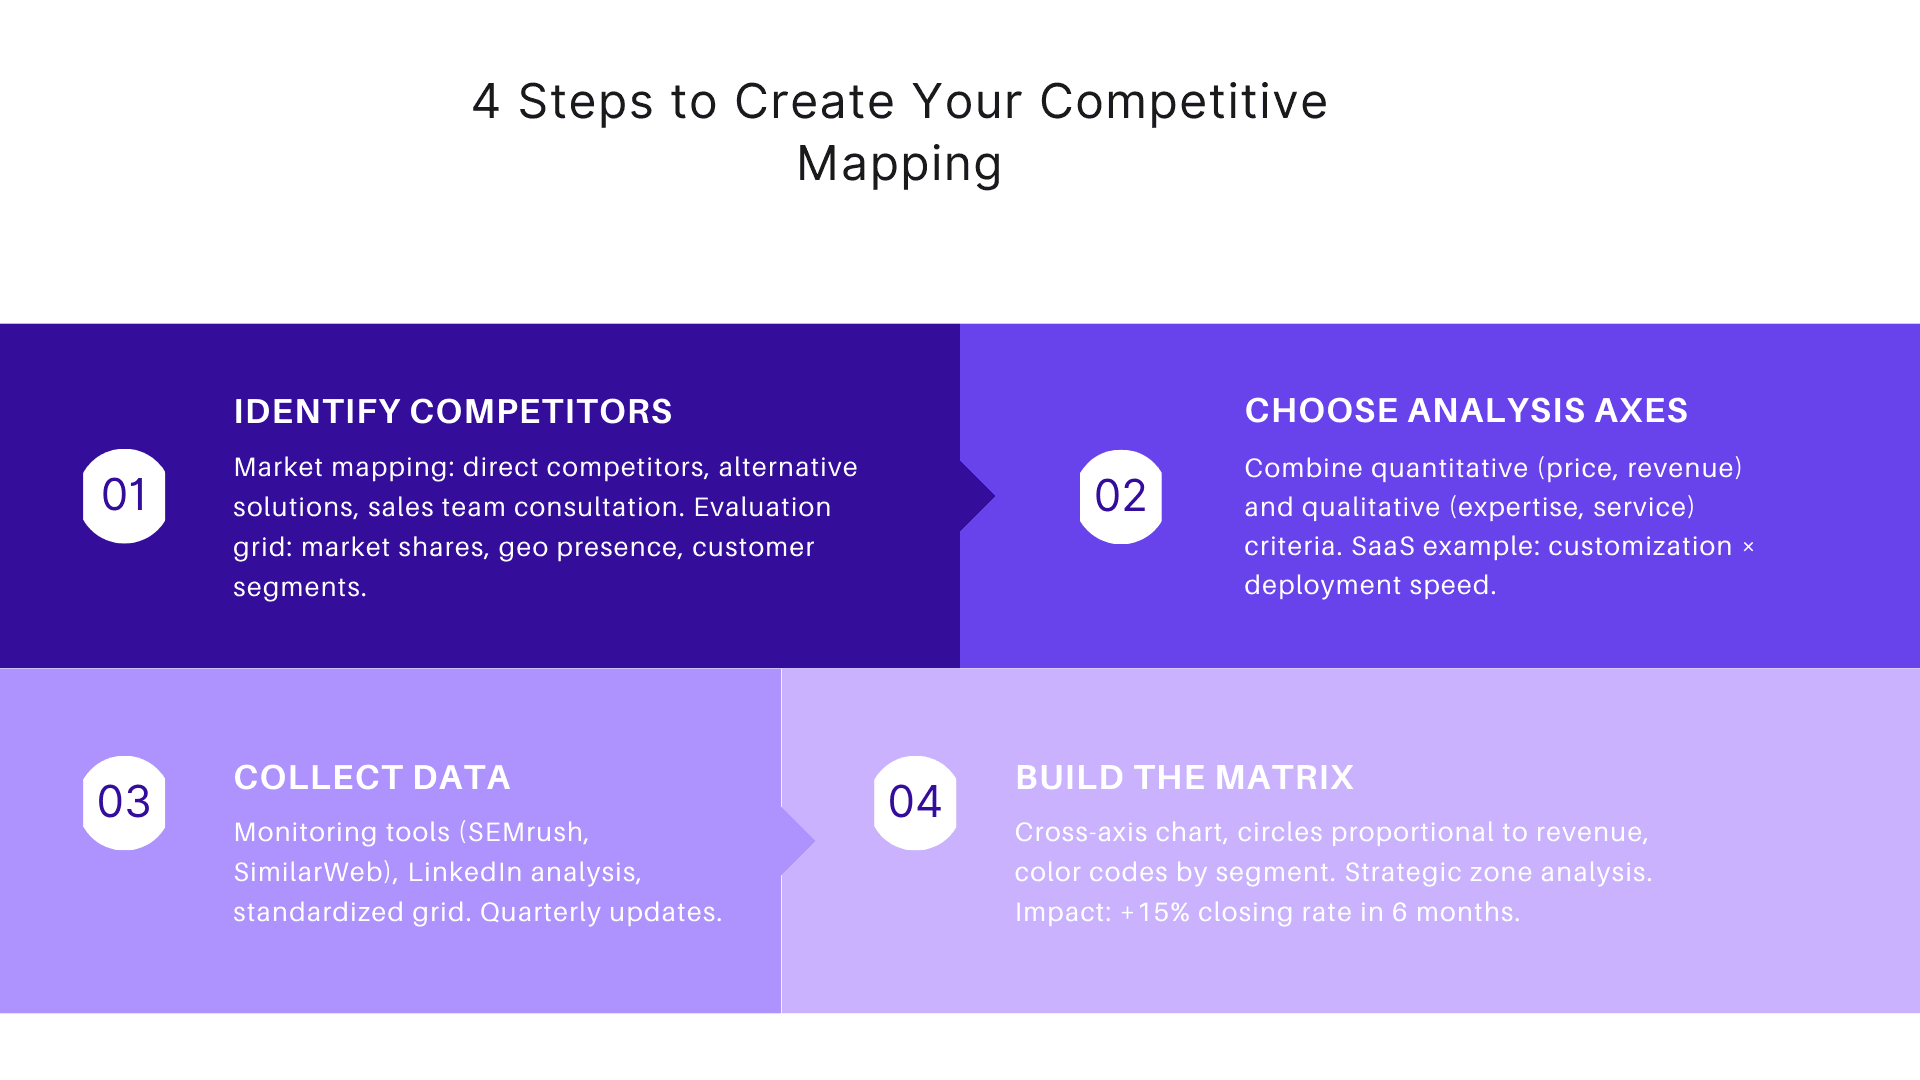
How to identify your strategic competitors
The first step involves conducting an exhaustive mapping of your market. Start by analyzing players who address the same needs as your B2B solution. This step often follows your sales action plan, which defines your target segments and differentiation strategy. Regular monitoring on LinkedIn and professional trade shows will reveal your direct competitors.
Don't forget to examine less obvious alternative solutions. A sales management software might compete with generic collaborative tools or internal developments. Consulting your sales teams will provide valuable insights on alternatives mentioned during negotiations.
Then establish an evaluation grid based on objective criteria: market shares, geographical presence, targeted customer segments. This methodical approach will guarantee you a clear vision of the competitive landscape and guide your strategic choices.
Selecting relevant analysis axes
Selecting your analysis axes relies on measurable indicators adapted to your sector of activity. A B2B salesperson might cross-reference proposal conversion rates with average signing delays.
The objective is to select criteria that reflect your field reality. For example, in the digital solutions domain, associate a quantitative axis like return on investment with a qualitative axis such as user satisfaction.
Differentiating criteria vary according to your market. For a SaaS solution, consider functionality customization and deployment speed. The judicious choice of your axes will transform your mapping into a powerful strategic tool for your sales team.
Collecting and organizing marketing data
A competitive mapping's success relies on methodical information collection. Automated monitoring tools like SEMrush or SimilarWeb provide valuable data on web traffic and your B2B competitors' digital strategies. These insights, when coupled with distribution channels analysis, highlight how competitors reach their customers.
Professional social network analysis reveals your rivals' marketing positioning and communication. LinkedIn proves particularly rich in information about B2B companies.
Structure your data in a standardized analysis grid including:
- Each competitor's strengths and differentiators
- Market awareness and presence
- Deployed marketing strategies
- Overall competitive environment
Quarterly updates of this information guarantee your analysis relevance in a constantly evolving B2B market.
Key Steps to Create Your Matrix
Chart construction and positioning
Creating your mapping begins by developing a crossed-axis chart on your preferred spreadsheet. Place your chosen criteria on the x and y axes, defining a relevant scale from 1 to 10 for each dimension.
Represent each market player with a distinct point. To enrich visualization, use circles of varying sizes according to revenue or market share. Color codes also allow quick segment distinction: blue for premium, green for entry-level market.
A practical tip involves adding text boxes to annotate remarkable positioning. For example, mark "premium zone" or "niche market" at strategic chart locations.
Strategic zone analysis
Identifying strategic zones on your mapping reveals major commercial opportunities. A concentration of players in the same sector signals strong competitiveness. Conversely, sparsely occupied spaces merit thorough analysis: do they represent a profitable niche market or an abandoned zone due to lack of demand?
Reading competitive clusters allows refining your B2B positioning. A saturated segment with similar offerings suggests the need for marked differentiation. An intermediate zone may indicate development potential, particularly in transforming markets.
Pay attention to player movements between zones. These strategic shifts often anticipate market evolutions and can guide your future commercial decisions.
Results interpretation
In-depth reading of your perceptual map reveals unexploited B2B commercial opportunities. Positioning trend analysis allows anticipating market mutations and adjusting your strategy accordingly.
A well-interpreted mapping highlights performance gaps between sector players. For example, in the cloud solutions domain, the correlation between service level and pricing can reveal poorly served segments.
To maximize your analysis value, focus on differentiation indicators. A SaaS solution might discover that a unique combination between customization and customer support represents a major distinctive advantage in the market.
Practical Applications by Industry Sector
Mapping in retail distribution
French retail distribution presents a fascinating application terrain for competitive mapping. Price-quality axes reveal clear distribution between discount chains like Lidl or Aldi, and premium players such as Monoprix or Grand Frais.
A second mapping based on customer experience and service diversity shows new model emergence. Carrefour and E.Leclerc stand out through their omnichannel strategy combining drive, delivery, and convenience stores.
Digitalization radically transforms the sector. Pure players like Amazon Fresh disrupt traditional codes, while historical chains strengthen their digital presence. This market mutation opens perspectives for brands that can combine price accessibility and service innovation.
Technology sector positioning analysis
The technology sector requires multidimensional positioning analysis, beyond the simple price-functionality ratio. Solution scalability, their integration level with existing ecosystems, and their innovation capacity represent crucial evaluation axes.
Tech companies adopt highly targeted niche strategies. A software publisher can maximize its impact by concentrating resources on a specific vertical segment, like healthcare or finance, rather than dispersing efforts across multiple markets.
Technology maturity and user experience form a determining duo in sector mapping. The most performing solutions combine robust architecture with intuitive interface, creating a significant entry barrier for new entrants.
Luxury and fashion case studies
The luxury sector reveals a fascinating competitive mapping application. Premium brands adopt sophisticated positioning based on heritage and innovation. Hermès and Louis Vuitton cultivate artisanal excellence while Gucci and Saint Laurent bet on creative audacity.
Fashion market analysis shows marked segmentation between accessible luxury and ultra-luxury. Chanel maintains its exclusive position through selective distribution. Conversely, Michael Kors opts for a controlled expansion strategy.
Sustainability becomes a major axis of modern mapping. Stella McCartney redefines responsible luxury codes. This sector mutation pushes traditional players toward reinventing their value proposition, blending prestige and environmental commitment.
Positioning Analysis Tools and Software
Excel solutions for competitive mapping
Excel establishes itself as a powerful tool for creating dynamic competitive mappings. The scatter plot function allows visualizing player positioning according to your chosen analysis axes.
To optimize your Excel mapping, start by structuring your data in distinct columns: competing companies, evaluation criteria, and assigned scores. Calculation formulas then automate your perceptual map updates.
A pivot table enriches your analysis by allowing data filtering by market segment or geographical zone. Sales professionals can quickly adapt their presentation according to client context.
Customizing markers and labels reinforces your mapping readability. Use distinctive colors for each competitor and add text zones to highlight strategic opportunities.
Specialized software and online services
Modern SaaS platforms revolutionize competitive mapping creation. Solutions like SEMrush or Ahrefs offer advanced market analysis functionalities, allowing automatic visualization of player positioning according to multiple criteria.
Artificial intelligence now enriches these tools by automating competitive data collection and generating valuable insights on market movements. A major advantage for B2B sales teams that can update their analyses in real-time.
Collaborative platforms like Miro or Lucidchart facilitate teamwork around mapping. Their customizable templates and sharing functions transform competitive analysis into a dynamic and collective exercise.
Free models and templates
Free online resources offer an excellent starting point for creating your competitive mapping. Sites like Business Plan Excel provide ready-to-use models in Word, Excel, and PowerPoint formats, adapted to B2B specificities.
The HubSpot library abounds with specialized templates by industry sector. A tech sector salesperson will find, for example, preformatted matrices to compare product characteristics and pricing positioning.
The Canva site offers customizable professional designs for your client presentations. These models integrate coherent color codes and layouts optimized for quick reading of your competitive analysis.
Optimizing Your B2B Commercial Strategy
Exploiting mapping insights
Transforming your mapping data into concrete actions requires rigorous methodology. Precise strategic diagnosis allows identifying unexploited growth zones in your market.
Your analysis should focus on three major aspects: positioning gaps with your direct competitors, under-exploited market segments, and emerging trends. It can also inform your FAB method (Features–Advantages–Benefits) or CRAC method approaches, helping sales teams tailor arguments to each client segment. Take the example of an HR software publisher that discovers an opportunity in advanced functionality customization, a need poorly covered by the market.
Optimal exploitation of your mapping goes through regular meetings with your sales teams. These sessions allow refining sales arguments and adapting your value proposition to specific needs of each client segment.
Adjusting your company positioning
Your mapping analysis reveals strategic improvement zones for your B2B company. Adopt a methodical approach by prioritizing high-impact adjustments: technical differentiation, sector expertise, or operational excellence.
Take the example of a cybersecurity solutions provider that strengthened its positioning by developing sharp expertise in industrial data protection. This specialization allowed it to stand out against market generalists.
Successful repositioning requires clear communication with your teams and clients. Create a roadmap detailing concrete actions: sales training, sales support adaptation, and argument updates.
Measuring impact on your performance
Measuring your competitive mapping results relies on precise key performance indicators. A monthly dashboard allows tracking your market share evolution, conversion rate, and price positioning compared to your direct competitors.
Companies adopting this approach notice an average 15% increase in their closing rate over 6 months. The reason? Better understanding of client expectations and more compelling commercial arguments.
A scoring system based on objective criteria like signing delay, average contract value, or client retention rate allows concretely evaluating your positioning effectiveness. This data, regularly updated, guides your future commercial decisions.
Frequently asked questions
What are the most important criteria for competitive mapping?
Prioritize criteria relevant to your sector and target market: pricing, product range, online visibility, customer service quality, and unique value proposition.
How frequently should competitive mapping be updated?
Minimum annually, but ideally quarterly or whenever significant market events occur (new competitor entry, regulatory changes, major product launches).
How to concretely transform competitive mapping into actions?
Identify differentiation opportunities and competitive gaps, then develop specific strategies to strengthen your market positioning and address unmet customer needs.