ARPU fundamentals for your business
What is average revenue per user?
ARPU represents an essential economic barometer that calculates the average revenue generated by each active user of your service. This metric proves particularly relevant in subscription models, where profitability depends directly on monetizing your customer base.
Let's take a concrete example: a B2B SaaS platform bills its different offerings between $50 and $200 per month. Its $120 ARPU reveals the distribution of its clientele across these different pricing tiers. A growing ARPU signals an increased ability to generate revenue per user, whether through upgrades or additional sales.
Segmenting this indicator by offer type or user category helps identify your most promising growth levers.
How to accurately calculate your ARPU
The basic formula for calculating ARPU breaks down into two elements: total revenue over a given period divided by the number of active users.
For an accurate calculation, start by defining your analysis period (monthly recommended for better responsiveness). Then add up all your revenue: subscriptions, additional services, and complementary sales.
Let's take a digital marketing agency example: with monthly revenue of $50,000 for 200 active clients, its monthly ARPU stands at $250. This data helps evaluate profitability per client and adjust offerings accordingly.
To refine your analysis, segment your ARPU by client type or offering. This granularity reveals the high-value segments of your portfolio.
Different types of ARPU: monthly vs. annual
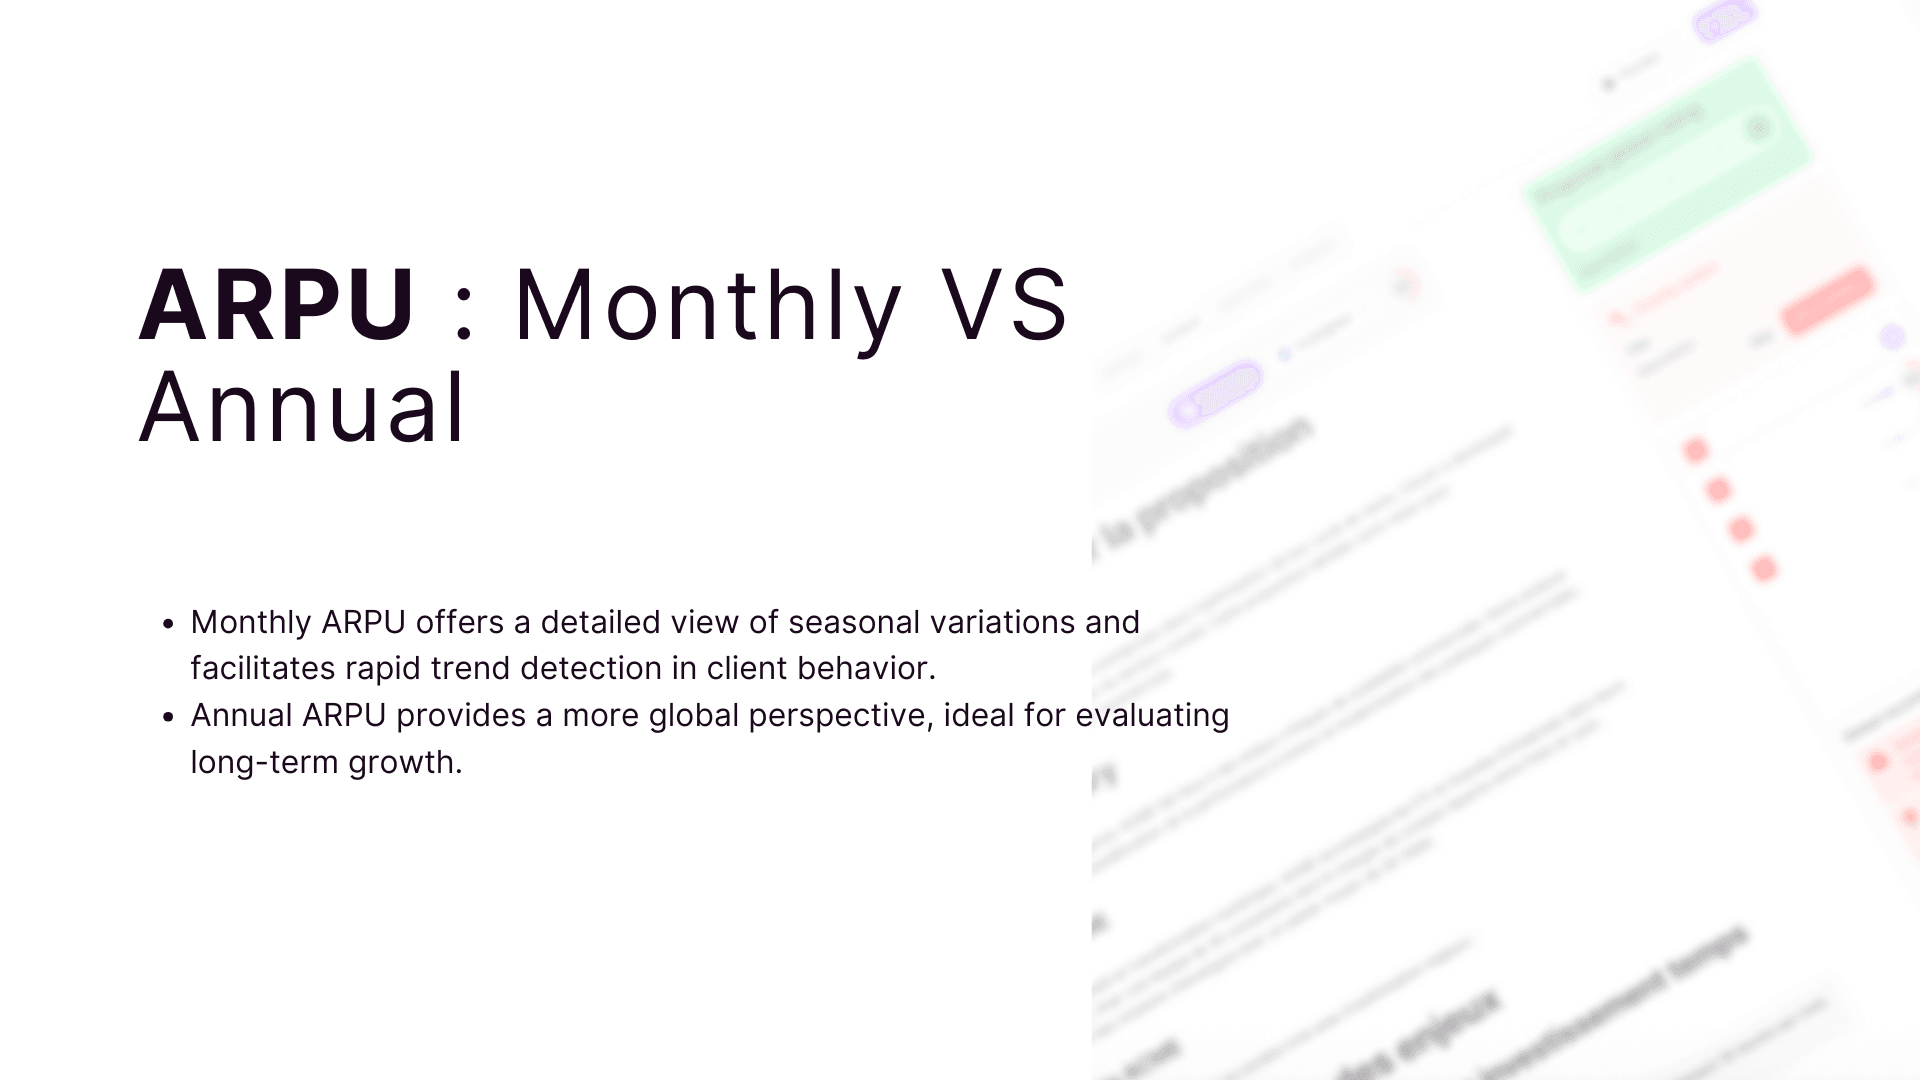
The choice between monthly and annual ARPU depends on your business model. Monthly ARPU offers a detailed view of seasonal variations and facilitates rapid trend detection in client behavior. Conversely, annual ARPU provides a more global perspective, ideal for evaluating long-term growth.
A B2B consulting firm illustrates this duality well: its monthly ARPU fluctuates between $800 and $1,200 depending on activity peaks, while its stable annual ARPU of $11,000 reveals consistent growth in its client base.
Combining both metrics enriches the analysis: monthly tracking guides immediate sales actions, while annual validates overall strategy and reassures investors about financial potential.
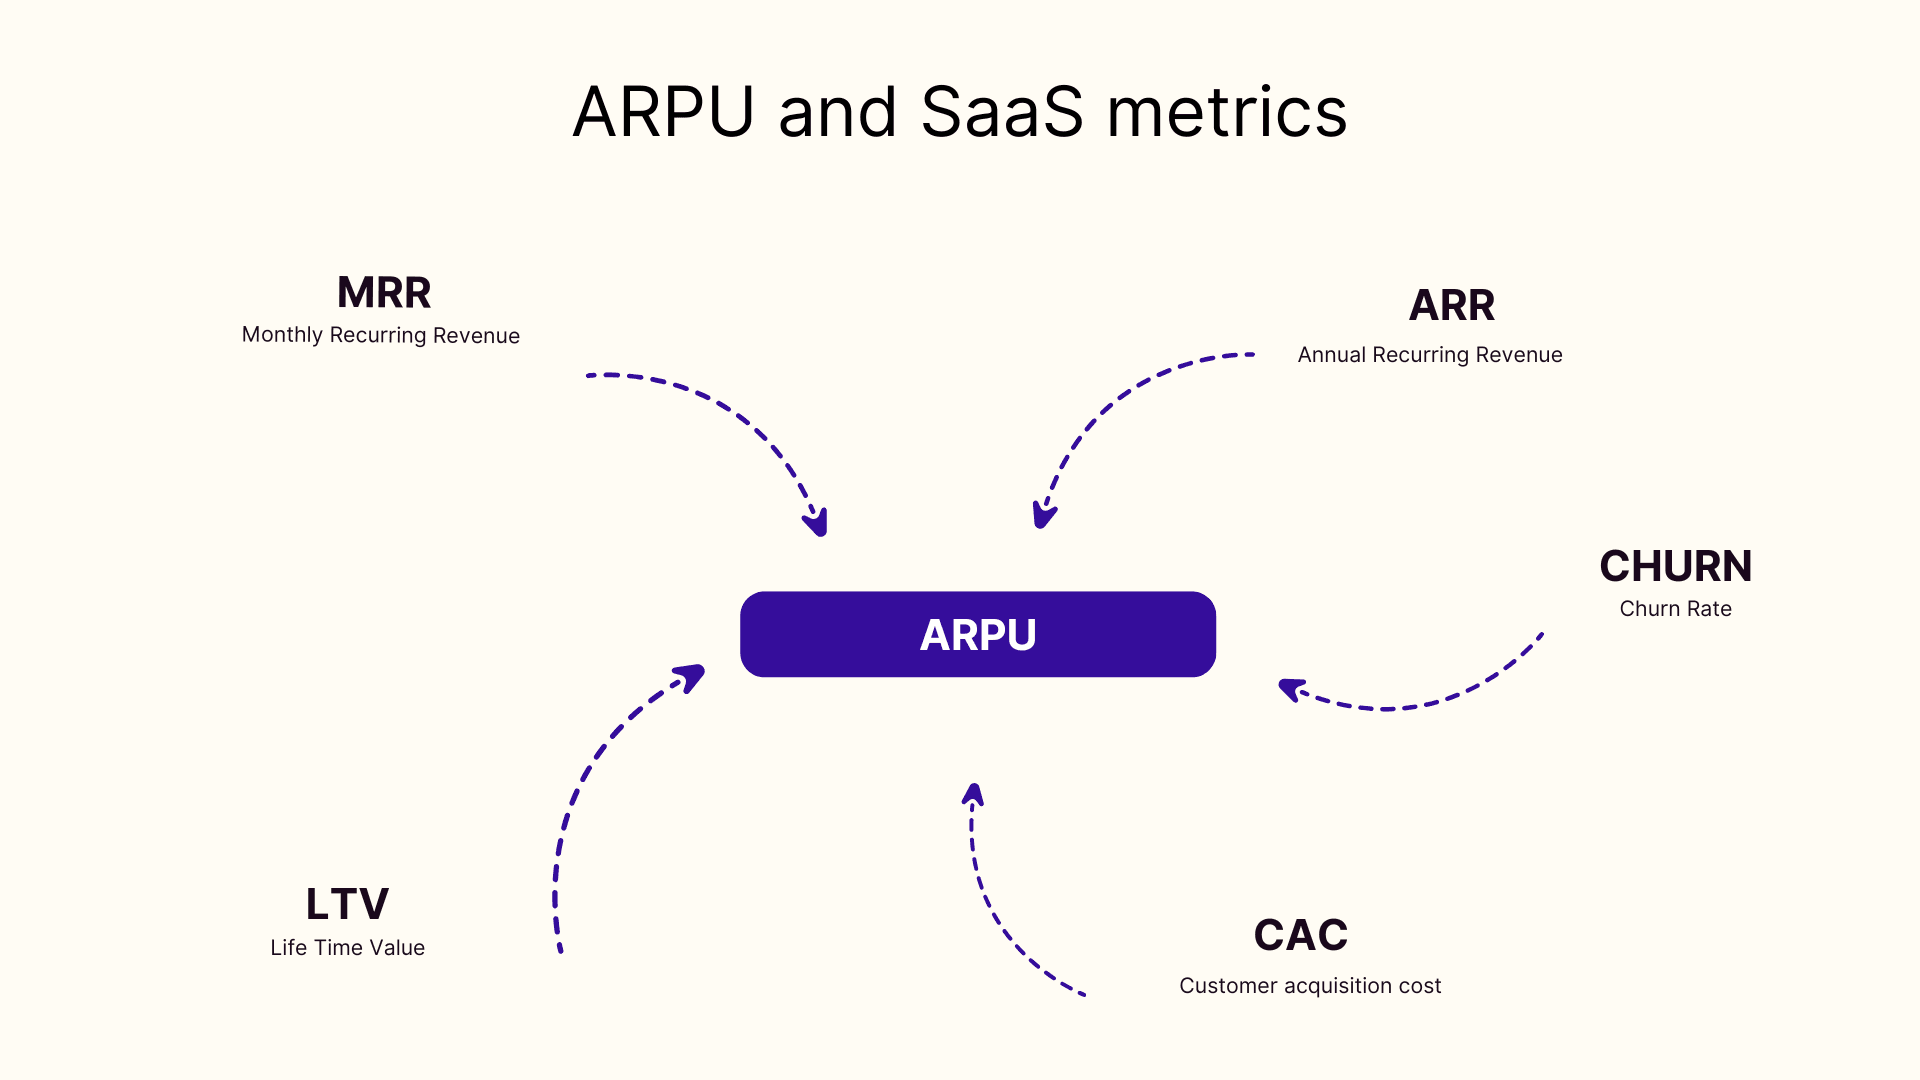
ARPU and essential SaaS metrics
Relationship between ARPU, MRR, and ARR
The synergy between ARPU, MRR (Monthly Recurring Revenue), and ARR (Annual Recurring Revenue) enables comprehensive analysis of a SaaS company's financial health. An ARPU of $100 multiplied by 500 active clients directly determines your MRR at $50,000. This monthly base, projected over 12 months, establishes your ARR at $600,000.
The power of these metrics lies in their complementarity. ARPU detects upsell opportunities by segment, while MRR measures the immediate impact of your sales actions. ARR, meanwhile, projects your long-term growth trajectory.
Strategic segmentation of these indicators by client type or offering transforms raw data into concrete action levers for your sales teams.
Churn impact on your ARPU
The relationship between churn rate and ARPU reveals crucial dynamics for your growth. High-ARPU clients generally show better retention, with churn rates oscillating between 2% and 6%.
This correlation is explained by deeper engagement and solutions better adapted to their specific needs. High ARPU allows for greater investment in customer support and loyalty programs, creating a virtuous cycle.
Losing a high-ARPU client impacts your business doubly: immediate drop in average revenue and increased acquisition costs to maintain growth. Fine analysis of purchasing behaviors by segment helps identify early warning signals and prevent departures.
CAC and LTV: The links with ARPU
High ARPU fundamentally changes the CAC (Customer acquisition cost) and LTV (Life Time Value) equation. The ability to generate more revenue per user justifies more substantial marketing investments for client acquisition.
The relationship works both ways: controlled CAC combined with optimized ARPU naturally maximizes LTV. Take the case of a B2B company that manages to increase its ARPU from $200 to $300 through cross-sell strategies. This 50% increase directly amplifies its LTV, making a higher CAC acceptable while maintaining an optimal LTV/CAC ratio of 3:1.
Segmented analysis of these three metrics by client type helps identify profitable segments and adapt acquisition strategies accordingly. For BDRs, this perspective clarifies which profiles justify higher acquisition costs.
Sectoral applications of ARPU
ARPU in the telecom sector
The telecommunications sector stands out for particularly strategic ARPU levels. The combination of voice, data, and premium content services enables average monthly revenue between $15 and $45 per subscriber.
Client segmentation plays a central role in revenue maximization. Operators rely on precise competitive analysis to refine positioning and launch premium packages. Operators offer premium packages enriched with additional services like 5G, streaming, or international roaming.
A revealing example: a targeted upgrade strategy focused on professional users can boost ARPU from $25 to $35 monthly. This approach relies on fine analysis of pain points and opportunities to enrich existing offerings.
Mobile apps and gaming ARPU
The mobile apps and gaming market presents a unique business model with diversified revenue sources. In-app purchases represent the lion's share of ARPU generation, followed by premium subscriptions and advertising.
Top-performing gaming apps reach monthly ARPU of $8 to $15 through balanced monetization strategy. The key lies in creating an engaging user experience that naturally encourages spending over time.
Optimization levers include:
- Personalized offers based on user behavior
- Regular launch of exclusive paid content
- Implementation of temporary events stimulating purchases
- Subtle balance between free content and premium features
Social media and streaming platforms
Social networks show considerable ARPU gaps, with Facebook generating $40.5 per user in 2024, followed by Twitter at $24.7. This disparity is explained by sophisticated advertising models and an engaged user base.
On the video streaming side, subscription price increases are transforming the landscape. Netflix maintains an average ARPU of $15.5 through its differentiated package strategy and ad-supported offering. Disney+ focuses on exclusive content to maximize lifetime value, with ARPU growing from $8 to $11 over the year.
Hybrid platforms now combine advertising and premium subscriptions to optimize their monthly recurring revenue. This approach allows adapting the offering according to each particular product and user segment.
ARPU optimization strategies
Marketing techniques to increase ARPU
Advanced personalization of commercial offers radically transforms performance. Sharing a case study during the sales process demonstrates the link between tailored adoption journeys and higher ARPU. A B2B company increased its ARPU by 45% by adapting its proposals to the specific needs of each client segment.
Predictive marketing based on behavioral analysis revolutionizes the detection of additional sales opportunities. For example, automatic identification of favorable moments to propose premium features triples upgrade offer acceptance.
Creating personalized adoption journeys strengthens client engagement. A structured approach, combining customized training and proactive support, accelerates account value growth. Users benefiting from this program generate 30% higher ARPU than average.
Pricing optimization and packages
Smart package structuring radically transforms ARPU. A pricing architecture based on perceived value, rather than costs, naturally encourages user upgrades. Multi-level offerings create a clear evolution path, where each tier brings high-value features.
Pricing experimentation reveals unsuspected levers: an A/B test on package presentation demonstrated that strategic highlighting of the middle plan stimulates conversions to this more profitable offering. Price segmentation based on actual usage optimizes customer satisfaction while maximizing revenue.
A SaaS company boosted its ARPU through targeted complementary modules. This modular approach makes upgrades more psychologically accessible than a complete plan change.
Reducing churn for better ARPU
Mastering churn rate directly transforms your ARPU. In-depth client data analysis reveals that early detection of disengagement signals doubles retention action effectiveness.
A proactive monitoring program, based on precise usage indicators, anticipates departure risks. For example, a 30% usage drop over two weeks automatically triggers personalized support, reducing churn by 40% on these at-risk accounts.
Implementing a continuous feedback system strengthens client engagement. A B2B company reduced its annual churn rate from 15% to 8% by adapting its services based on user feedback. This constant improvement approach naturally retains profitable clients, mechanically optimizing overall ARPU.
High-performing ARPU KPIs and dashboards
Tracking and analysis tools
Dynamic dashboards revolutionize ARPU management in 2025. Solutions like Data Studio or Power BI enable real-time visualization of revenue evolution by client segment.
The power of AI-based predictive tools changes the game. For example, machine learning software enabled a SaaS company to identify with 85% accuracy accounts likely to increase their consumption.
Marketing automation platforms enrich behavioral analysis. A software publisher boosted its ARPU by 35% by automatically triggering personalized actions based on detected usage patterns. These modern tools make data-driven sales performance management accessible.
Benchmarks by industry sector
ARPU levels vary considerably across markets in 2025. The telecommunications sector maintains monthly ARPU between $15 and $25 for consumer mobile plans. B2B SaaS stands out with higher averages: $50 to $150 per user for productivity solutions.
Mobile gaming shows more modest values, between $2 and $8 monthly, while music streaming apps gravitate around $5 to $7. Premium video streaming platforms reach $10 to $15.
Segment analysis shows that specialized B2B solutions regularly exceed $200 monthly ARPU. Online financial services position themselves in an intermediate range of $30 to $60 per active user.
Frequently asked questions
How do you calculate ARPU (average revenue per user) in a simple way?
By dividing total revenue generated over a defined period by the number of sales deals closed during the same period.
Why is ARPU a particularly important indicator for SaaS-type companies?
Upselling and cross-selling existing clients, restructuring pricing with tiered options, and improving qualification to focus on higher-value opportunities.
What are the main effective strategies to increase your company's ARPU?
At least monthly for trend tracking, with deeper analysis quarterly. Compare against industry benchmarks and your historical performance.