The Fundamentals of Sales KPIs
The Meaning and Importance of Sales KPIs
A sales KPI translates your daily actions into measurable data. For example, your 15% conversion rate reveals how many prospects become customers. These metrics help you anticipate future results and quickly adjust your strategies.
The power of KPIs lies in their ability to turn intuitions into verifiable facts. A sales director who tracks the average number of contacts before a deal is signed can train their team on the specific steps that need more attention.
Modern dashboards now combine several key indicators like Customer Acquisition Cost (CAC) or Customer Lifetime Value (CLV). This 360° view guides every strategic decision toward a specific goal: increasing revenue while optimizing resources.
The 4 Pillars of an Effective Sales KPI
A high-performing measurement system is built on four essential fundamentals. Relevance is the first pillar: each metric must address a specific business objective. The second pillar, data reliability, ensures that decisions are based on verified and up-to-date figures.
Simplicity of interpretation is the third foundation: teams must quickly understand the meaning and implications of each measure. For example, a sales manager tracks the "number of meetings/number of deals signed" ratio to optimize their closing process.
The final pillar revolves around actionability: the metrics must clearly identify the corrective actions to be implemented. A declining average deal size triggers an immediate review of the sales strategy.
The Impact of KPIs on Team Management
Implementing indicators transforms managerial dynamics. A personalized tracking dashboard gives managers a clear view of individual and collective performance, promoting targeted coaching for each team member.
Team leaders use this data to adapt their management methods. For example, a salesperson who achieves 80% of their prospecting goals but struggles in the closing phase will receive specific coaching on negotiation.
KPIs also boost motivation through objective recognition of successes. A leader can highlight their team's achievements based on tangible results: number of opportunities generated, win rate, or monthly recurring revenue.
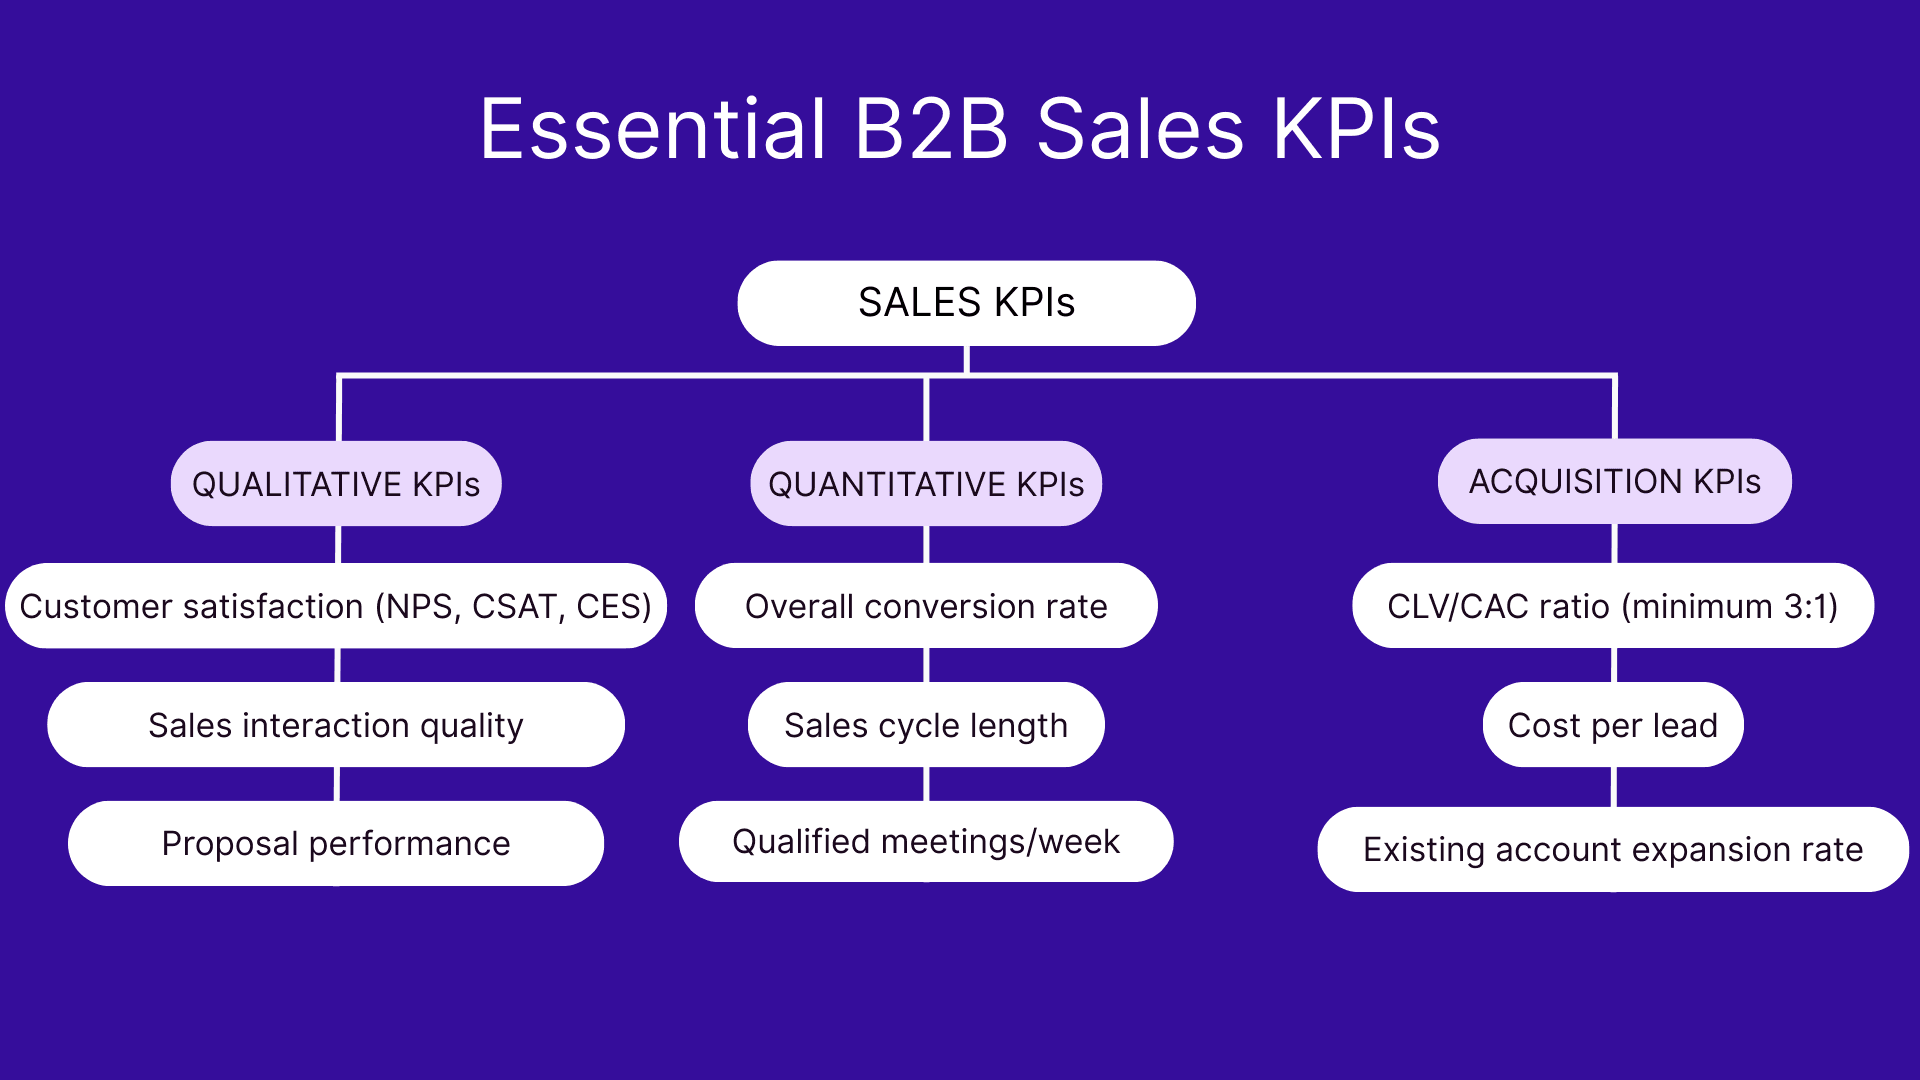
Essential Qualitative Sales KPIs
Measuring Customer Satisfaction and Loyalty
Measuring customer satisfaction in 2025 relies on three major statistics. The Net Promoter Score (NPS) assesses customers' likelihood to recommend your services, while the CSAT measures their immediate contentment after each interaction.
The Customer Effort Score reveals the perceived ease of their buying journey. Regularly tracking this data helps anticipate churn risks and optimize retention.
Leading companies also measure the monthly repurchase rate and the average length of business relationships. For example, a 5% increase in the retention rate can generate up to 25% more revenue in the long term.
Evaluating the Quality of Sales Interactions
The success of prospect interactions depends on precise engagement indicators. Detailed tracking of average response time, meeting frequency, and first-contact resolution rate reveals the true effectiveness of conversations.
Top-performing companies establish a structured evaluation grid for each touchpoint. For example, during a product demo, the salesperson systematically notes the level of interest shown, objections raised, and the relevance of the proposed solutions.
A scoring table assigns points based on perceived quality: clarity of speech, active listening, personalization of responses. This methodical approach transforms subjective data into concrete metrics, guiding the continuous improvement of sales practices.
Analyzing Proposal Performance
Evaluating sales proposals relies on strategic metrics that reveal their effectiveness. The acceptance rate measures the ratio of sent quotes to signed deals, providing a clear view of your documents' persuasive power.
The average time to sign is another revealing indicator. A proposal that takes more than 15 days to be validated suggests friction points to be optimized in its structure or content.
A proposal scoring system evaluates the quality of key elements: clarity of the benefits presented, relevance of the customer references cited, and precision of the financial terms. This analysis helps identify the components that significantly increase the chances of success.
Tracking the average value of accepted versus rejected proposals helps refine your pricing position and sales arguments.
Key Quantitative Sales KPIs for B2B Commerce
Conversion Rate and Sales Cycle
Measuring the overall conversion rate remains an essential thermometer of B2B performance in 2025. Top-performing companies segment this data by acquisition channel and by stage of the sales pipeline. An experienced salesperson pays particular attention to the conversion from the first meeting to the signed deal.
The average sales cycle length completes this picture, with notable variations across sectors. For B2B SaaS software, the standard timeframe ranges from 3 to 6 months. An in-depth analysis of each phase helps identify bottlenecks and accelerate decision-making.
Weekly tracking of these two metrics, coupled with segmentation by deal size, provides a solid basis for quickly adjusting the sales strategy.
Sales Prospecting Indicators
Measuring prospecting activity revolves around three fundamental metrics in 2025. The lead qualification rate assesses the relevance of identified contacts against the company's criteria. An optimal ratio is between 25% and 35% of total prospects.
The number of qualified meetings per week is a precise barometer of the effectiveness of prospecting actions. In the B2B industrial sector, for example, an experienced salesperson maintains an average of 8 to 12 decision-maker meetings weekly.
The cost per lead completes this dashboard. This data, compared to potential revenue, allows for quick adjustments to the most profitable prospecting channels, as social selling often shows a higher ROI than traditional cold calling.
Customer Acquisition Metrics
Acquisition profitability is measured by the ratio between the long-term Customer Lifetime Value (CLV) and the marketing budget invested. High-performing companies maintain a minimum CLV/CAC ratio of 3, ensuring healthy growth.
A modern acquisition dashboard integrates the dynamics of recurring revenue (MRR) and the ramp-up speed of new accounts. For example, shortening the activation time from 45 to 30 days signals a major improvement in the onboarding process.
Expansion metrics reveal the ability to grow the value of existing accounts. The monthly cross-selling rate and the average contract increase at renewal are leading indicators of sustainable growth.
Creating a High-Performing Sales Dashboard
Selecting Relevant Indicators
Successful sales management relies on a rigorous selection of KPIs. Start by identifying your priority strategic objectives: acquisition, retention, or developing the existing portfolio.
Limit yourself to 5-7 key indicators per dashboard to maintain precise and actionable tracking. Prioritize metrics directly linked to your action levers: proposal response rate, average time to sign, average deal value.
Verify the reliability of the source data and its update frequency. A KPI based on incomplete or outdated data can steer your decisions in the wrong direction. For example, a conversion rate calculated without considering qualified leads will skew your performance analysis.
Organizing Data in Excel
Structuring data in Excel requires a methodical approach. First, create a sheet dedicated to raw data where each row represents a transaction and each column a specific KPI.
A second sheet will be used for automated calculations using functions like VLOOKUP and SUMPRODUCT. These formulas allow you to aggregate your sales results by period, by salesperson, or by product.
Consider integrating a dynamic list to quickly filter your data by different criteria: sales managers, new customers, or total purchases per year. This organization facilitates daily updates of the figures while ensuring their reliability.
Creating pivot tables will complete this architecture by offering a summary view of your performance.
Effective Visualization and Reporting
The visual representation of your KPIs determines their impact on decision-making. A modern sales dashboard favors real-time charts over static tables. Waterfall charts perfectly visualize the evolution of the sales pipeline, while circular gauges instantly display conversion rates.
To maximize readability, adopt a consistent color code: green for goals met, red for alerts. Comparative charts allow for a quick analysis of performance between different periods or sales teams.
Adding interactive elements transforms your reporting into a true analysis tool. Dynamic filters by geographic area or by product offer a personalized view of sales results for each user.
Artificial Intelligence and Next-Generation Sales KPIs
Automation of Data Collection
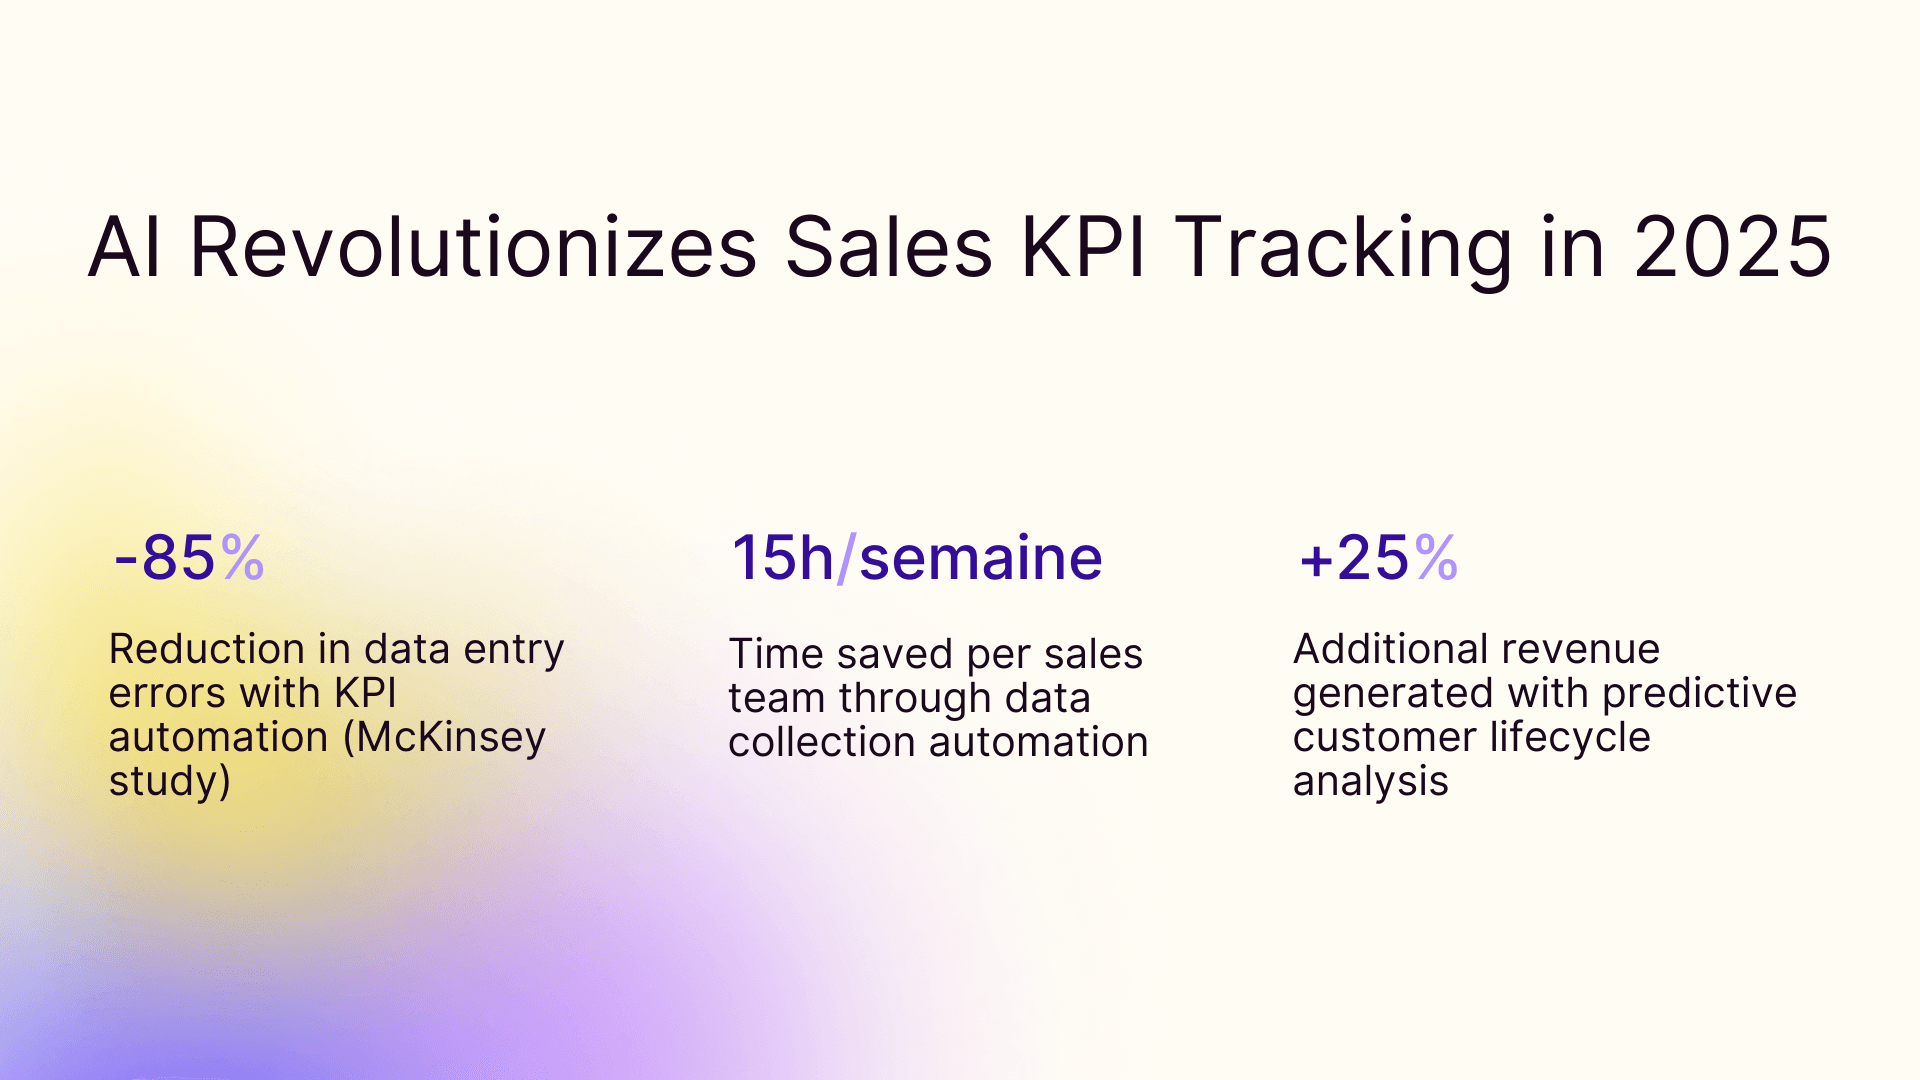
Digital transformation is revolutionizing sales KPI tracking in 2025. Automation allows teams to save up to 15 hours per week on manual entry of performance indicators.
Modern solutions automatically sync your data from your sales tools, CRM, and marketing platforms. This centralization ensures increased reliability: according to a McKinsey study, companies using automation reduce their data entry errors by 85%.
AI systems now continuously analyze your return on investment. For example, an automated system can detect a 5% drop in conversion rate and instantly alert the relevant teams.
Automation also allows you to enrich your prospecting files with qualified external data, optimizing the relevance of your sales actions.
Prediction and Advanced Analysis
Predictive models are revolutionizing sales performance analysis in 2025. These tools decipher past trends to anticipate purchasing behaviors and optimize the closing rate.
A telling example: customer lifecycle analysis helps identify the right moment to offer an upgrade. The technology calculates the probability of conversion based on interaction history, purchasing behavior, and seasonality.
Scoring algorithms enrich each sales proposal by evaluating its relevance to the prospect's expectations. This scientific approach maximizes the chances of success by adapting the sales pitch to the specifics of each opportunity.
Modern analytics power goes further by detecting weak signals that herald customer disengagement, allowing you to act before it's too late.
Real-Time Optimization
Instant adjustment systems are revolutionizing sales management in 2025. A salesperson receives alerts on their smartphone as soon as a prospect views their proposal, allowing them to intervene at the opportune moment.
Dynamic dashboards automatically adapt daily goals based on morning performance. For example, a drop in sales before 11 a.m. triggers a readjustment of targets and recommendations for corrective actions for the afternoon.
Leading companies now use contextual notifications to guide their teams. A drop in the email response rate immediately prompts personalized suggestions for improving the sales pitch, maximizing the impact of each customer interaction.
Developing and Managing Sales Performance
Defining SMART Goals
The SMART method transforms your sales ambitions into achievable goals. This structured approach breaks down each objective into five key dimensions: Specific, Measurable, Achievable, Relevant, and Time-bound.
A B2B salesperson applying this method will turn "increase sales" into "generate $50,000 in revenue from new customers in the automotive sector by September 2025." This precise formulation guides action and facilitates the tracking of Key Performance Indicators.
Here are the essential criteria for an effective SMART goal:
- Specific: target a precise segment or product
- Measurable: define relevant, quantified KPIs
- Achievable: base it on the previous period
- Relevant: align it with your available resources
- Time-bound: set a clear deadline
Leading Teams with KPIs
Motivating sales teams involves a strategic use of KPIs. A performance dashboard accessible to everyone allows salespeople to track their progress in real-time and stimulates their engagement.
Implementing weekly challenges based on specific indicators naturally boosts results. For example, a competition on the closing rate creates healthy emulation among sellers while increasing overall productivity.
Managers benefit from organizing regular one-on-one meetings around personalized KPIs. This approach fosters a constructive dialogue about areas for improvement and recognizes the successes of each salesperson. A seller who visualizes their progress on their Customer Lifetime Value feels more involved in their success.
Continuous Strategy Adjustment
Constantly adapting your sales strategy relies on a detailed analysis of the data. A performance gap in monthly revenue triggers an immediate review of field actions.
Responsiveness to performance variations requires personalized alerts. A drop in the percentage of qualified prospects requires a quick review of qualification criteria.
Dynamic management relies on data based on observed results. For example, an increase in refund requests signals a need to improve product quality or customer service.
Monitoring indicators on your website helps identify emerging trends. A comparative analysis with the previous period reveals the priority areas for optimization to maintain a growing ARR while minimizing Churn.
Best Practices for Sales KPI Management
Frequency of Tracking and Analysis
Establishing an optimal tracking cadence for KPIs is a key success factor. Operational indicators require daily monitoring: number of calls made or email response rate.
A weekly rhythm is perfect for monitoring the sales pipeline and the opportunity conversion rate. This frequency allows for the quick identification of bottlenecks in the sales cycle.
A thorough monthly review of strategic metrics, such as average margin per customer or cross-selling ratio, guides tactical decisions. For example, a 10% drop in the renewal rate over two consecutive months requires a detailed analysis of the causes.
Communicating Results
Transmitting numerical data requires a structured methodology to maximize its impact. A visual format adapted to each recipient ensures better understanding: summary charts for management, detailed tables for operational managers.
Holding dedicated KPI meetings strengthens team engagement. A quick morning check-in on the day's goals, followed by a summary at the end of the week, helps everyone stay focused on their priorities.
Collaborative sharing tools facilitate access to data in real-time. A centralized dashboard, accessible from a smartphone, provides an instant overview of performance at all hierarchical levels.
Effective Corrective Actions
Detecting deviations in your KPIs requires quick and targeted responses. A drop in the email response rate triggers an immediate review of the subject lines and content of the messages — sometimes supported by structured questioning frameworks like the 5 Whys method.
Comparative analysis of performance by segment reveals the areas needing priority intervention. For example, when the closing rate drops in a specific sector, strengthening skills through personalized coaching sessions is necessary.
Sudden variations in the average revenue per customer call for a thorough diagnosis of sales practices. A high-performing salesperson can then share their best techniques in practical workshops, turning every difficulty into an opportunity for collective improvement.
Frequently asked questions
What are the most important types of sales KPIs to track for a B2B team?
It is crucial to track a mix of quantitative KPIs (revenue, conversion rate, deal velocity) and qualitative indicators (client satisfaction, team engagement) for a complete picture.
How do you choose the right sales KPIs that are relevant to your business?
By aligning your indicators with your company's strategic goals, ensuring each KPI drives actionable insights, and avoiding vanity metrics that don't impact business outcomes.
How often is it recommended to analyze your sales KPIs?
Operational KPIs (e.g., number of calls) track daily activity, while strategic KPIs (e.g., customer lifetime value) measure long-term business health and growth trajectory.