The fundamentals of modern sales management
What makes an effective sales dashboard?
A high-performing sales dashboard centralizes your strategic sales data on a single, dynamic interface. Its strength lies in its ability to quickly synthesize your essential results: revenue, conversion rates, and sales pipeline progress.
Take the example of a B2B sales team that tracks their opportunities daily. At a glance, each salesperson visualizes their qualified leads, scheduled appointments, and progress toward set targets.
The key to a successful dashboard? Automatic data updates, customized indicators based on your priorities, and clear visualization that facilitates rapid performance analysis.
Strategic objectives of sales tracking
Structured sales tracking enables measurable strategic objectives. Data centralization reveals performance across each market segment and accelerates the detection of growth opportunities.
Sales cycle analysis highlights friction points in the sales process. Managers can then adjust their tactics, reallocate resources, and maximize ROI on sales activities.
Regular measurement of conversion rates by channel identifies the most effective levers. A technology company, for example, increased sales by 25% by refocusing efforts on channels generating the best ROI.
Impact on director decision-making
A dynamic dashboard radically transforms the sales director's responsiveness to market changes. Instant visualization of gaps between forecasts and actual results enables orchestrating corrective actions without delay.
Consider a director who detects declining sales in a geographic region. Thanks to consolidated data, they quickly reallocate sales resources and adapt territorial strategy to maintain market share.
Centralized indicators also enhance dialogue quality with field teams. The sales director relies on factual data to challenge salespeople and define personalized action plans by sales territory.
How to create a high-performing sales dashboard
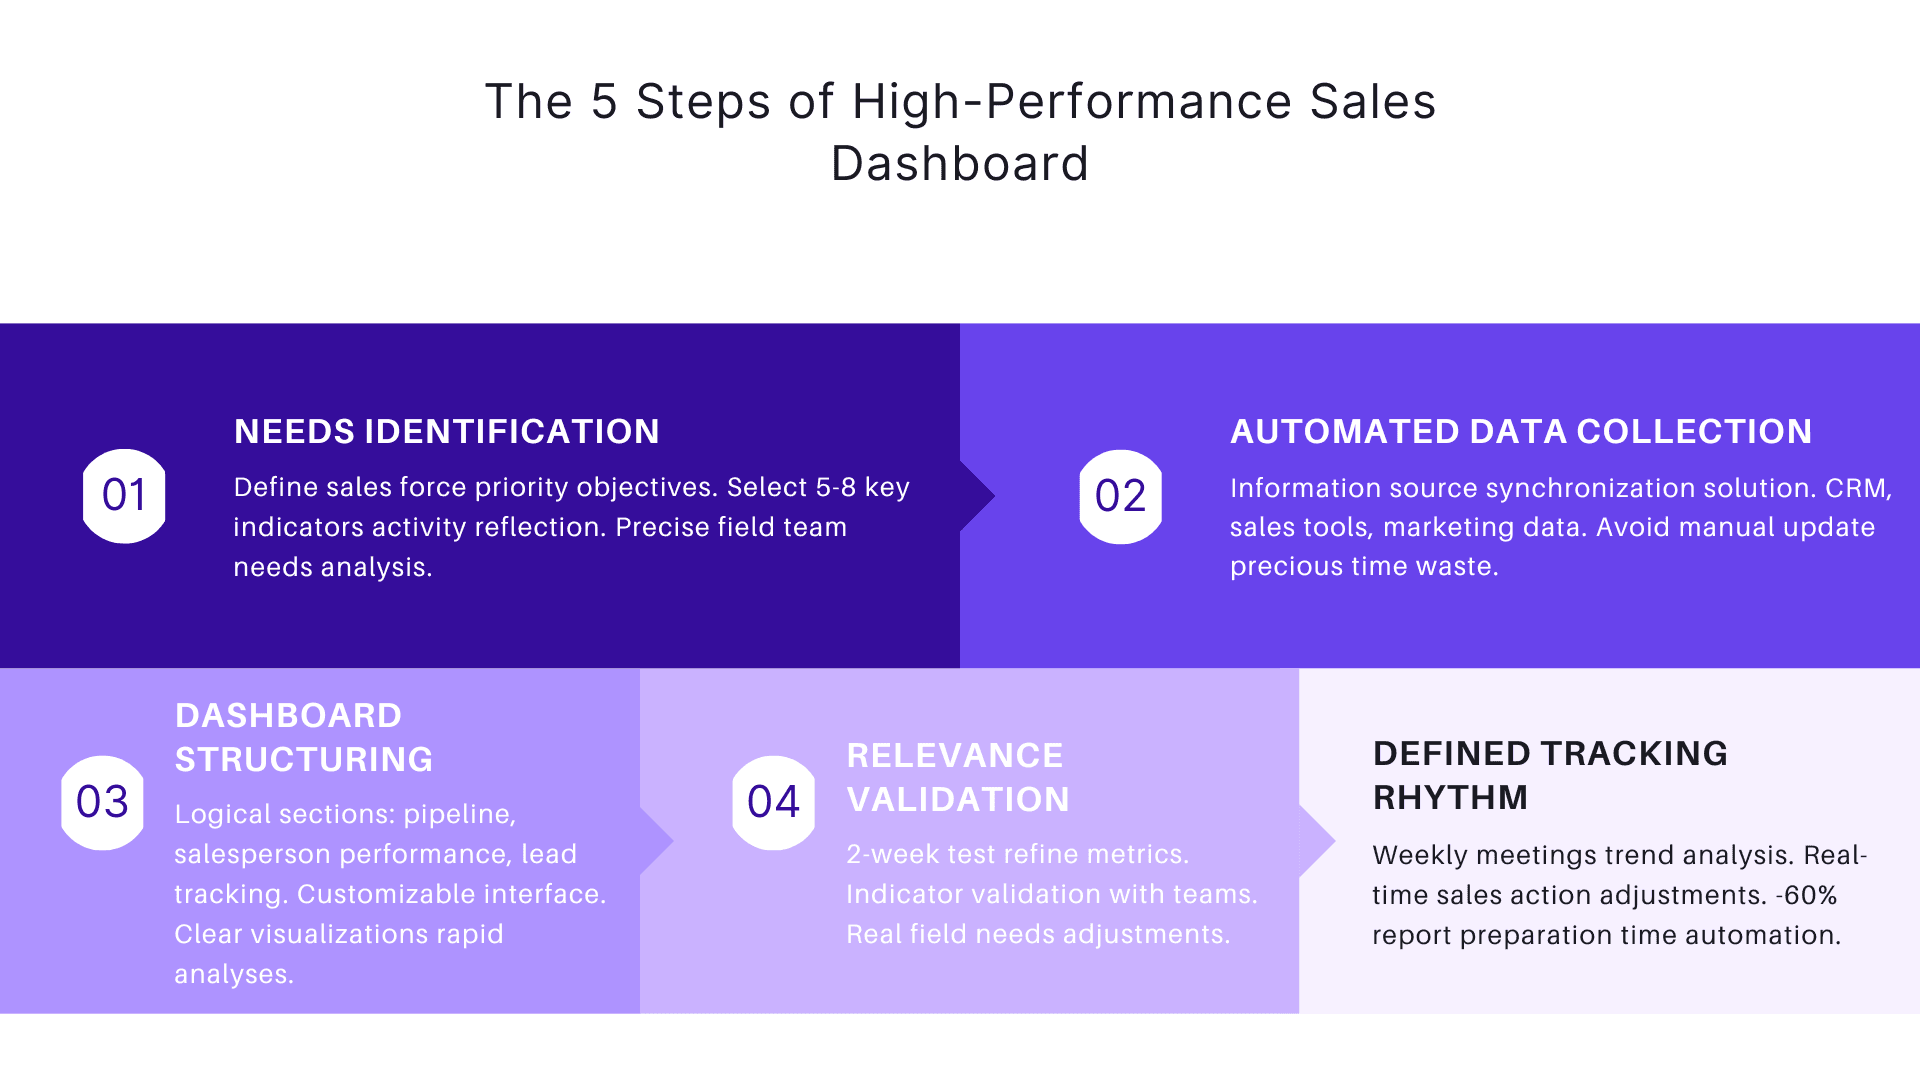
Simple 5-step methodology
Creating an effective management tool starts with precisely identifying your sales force's needs. Define your priority objectives and select 5 to 8 key indicators that reflect your sales activity.
The second step involves organizing automated data collection. Choose an appropriate solution that synchronizes your various information sources.
Then structure your customizable dashboard into logical sections: pipeline, performance by salesperson, lead tracking.
Validate each indicator's relevance with your teams before deployment. A two-week test allows you to refine metrics.
The final step establishes a precise tracking rhythm: weekly meetings to analyze trends and adjust sales actions.
Mistakes to avoid in construction
Creating an oversized dashboard represents the most common error. A sales manager who integrates too many indicators risks drowning essential information in a flood of unusable data.
Manual data updates expose your sales reporting to costly inaccuracies. Take the example of a B2B team that loses several hours weekly compiling figures: lost time reduces responsiveness to opportunities.
Another major pitfall lies in lacking clear vision of company needs. A standard copy-paste dashboard will never address your activity's specifics. Instead, favor a personalized approach based on your unique sales objectives.
The importance of sales action plans
A dashboard's success relies on a structured sales action plan that defines objectives to track. A B2B services company transformed its results by aligning indicators with quarterly action plans. Its dashboard now reflects strategic priorities: new account acquisition, average basket development, and customer retention.
Synchronization between action plans and dashboard metrics enables quick trajectory adjustments. Managers visualize key initiative progress and adapt strategy based on obtained results.
Dynamic action plan tracking via the dashboard also strengthens team engagement. Each salesperson better understands their contribution to global objectives and can measure the direct impact of daily actions.
Essential indicators for analyzing your sales
Must-have B2B sales KPIs
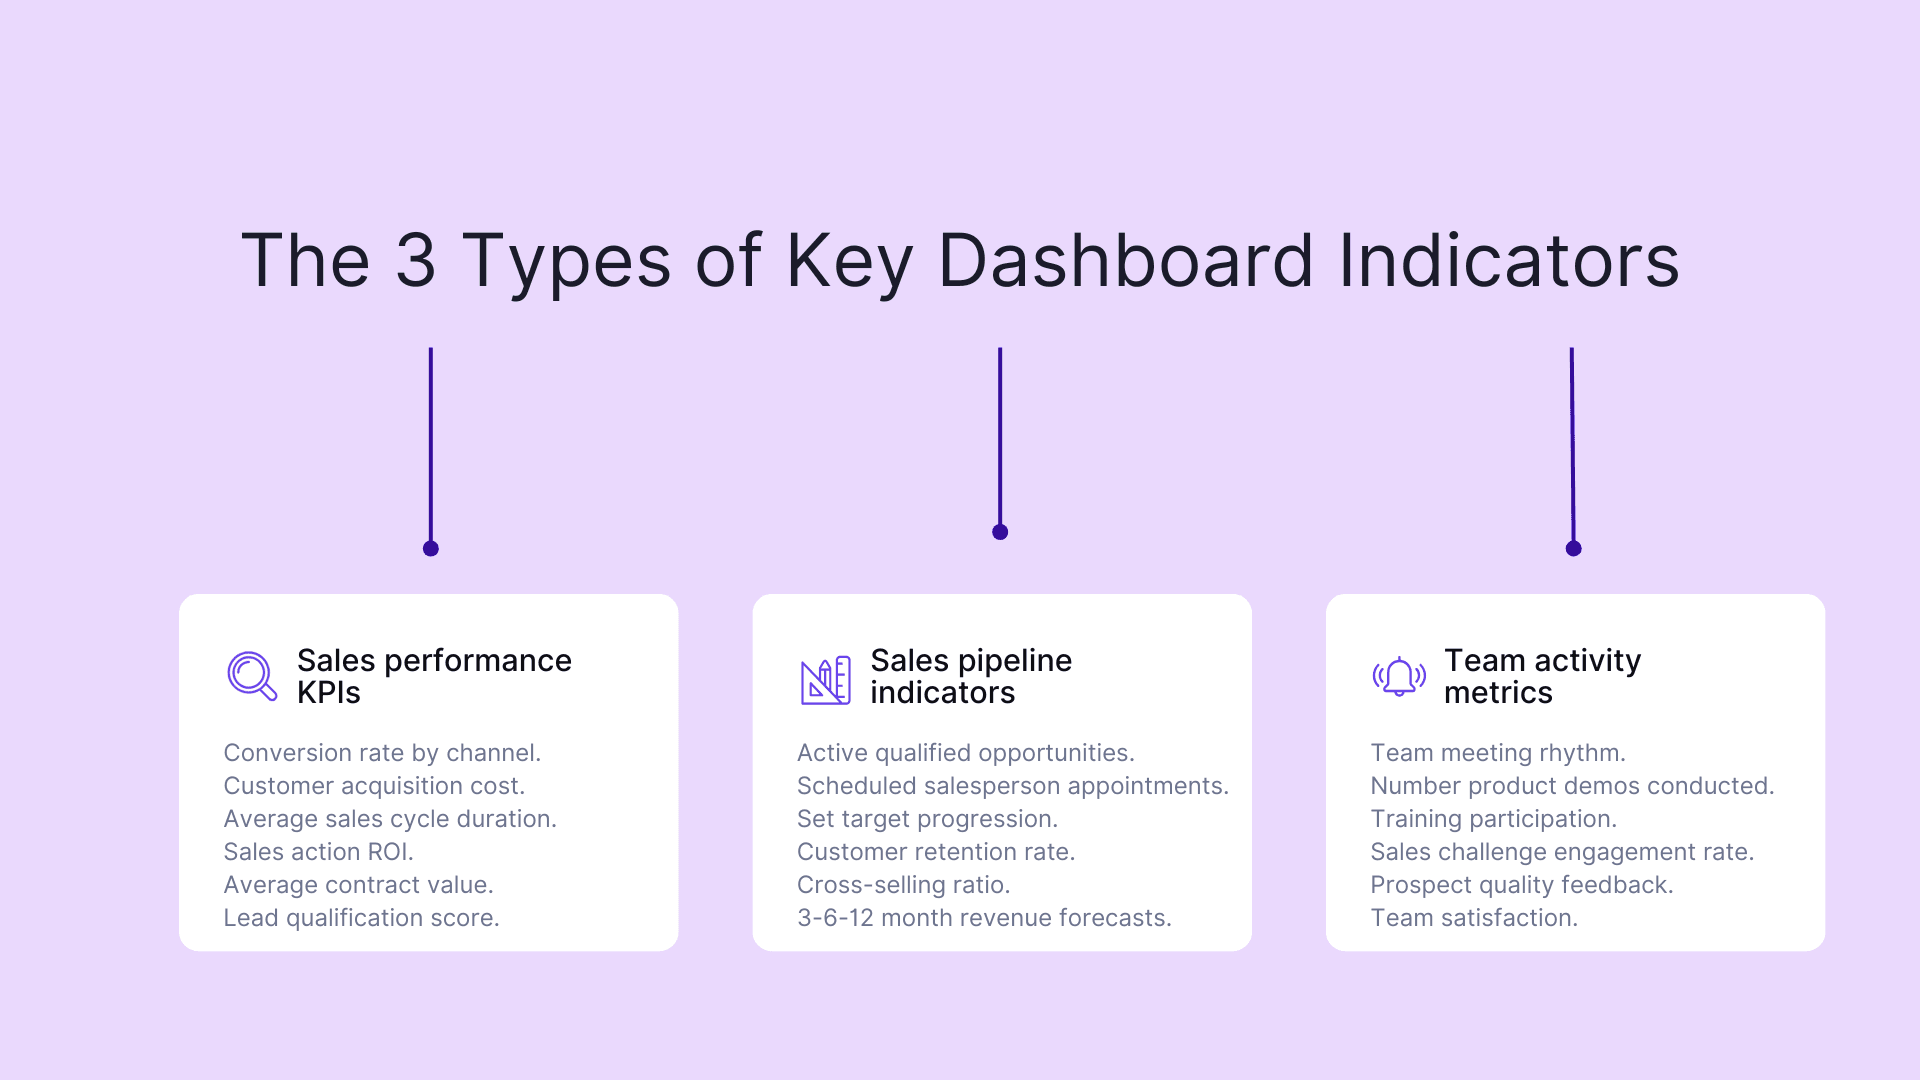
B2B sales success relies on carefully selected strategic metrics. Customer retention rate reveals the strength of long-term relationships established. Average contract value provides clear visibility into profitability per account.
Average opportunity conversion time constitutes a key indicator for optimizing the sales cycle. A lead qualification score helps prioritize high-potential prospects. Cross-selling ratio measures the ability to develop existing account value.
These KPIs should accompany customer acquisition cost analysis and sales ROI. Combining this data offers a 360° view of performance and improvement levers in the B2B environment.
Banking sector-specific metrics
The banking sector requires performance indicators adapted to its particularities. Net interest margin measures credit operation profitability, while the loan-to-deposit ratio evaluates balance sheet equilibrium.
Modern banking institutions also monitor digital service adoption rates among customers. This metric reflects agency digital transformation and behavioral evolution.
Customer satisfaction rate takes on particular strategic dimension in this sector. For example, a regional bank increased revenue by 15% by optimizing this score through personalized complaint tracking.
Banking sales performance is also evaluated via average customer equipment rate and commission revenue share.
Sales activity tracking
Sales activities require dynamic management that goes beyond raw numbers. A wise sales manager monitors team meeting rhythm, sales challenge engagement, and training participation.
Implementing an activity dashboard enables quick visualization of each seller's strengths. A tech company transformed results by creating a dedicated field activity dashboard: number of product demonstrations conducted, client event participation rates, and prospect feedback quality.
The best managers also integrate qualitative data like team atmosphere or collective motivation. These elements enrich analysis and enable real-time activity adjustments.
Technology tools for your sales dashboard
Excel: free templates and corrected exercises
Ready-to-use Excel templates provide a solid foundation for starting your sales tracking. These customizable models integrate essential functionalities: automatic filters, pivot tables, and pre-formatted charts.
To master these tools, practical exercises guide you step by step. A first module familiarizes you with creating conversion rate calculation formulas. A second accompanies you in setting up impactful visualizations for team meetings.
Excel's true strength lies in its flexibility. A sales manager, for example, adapted a standard template to create a custom scoring dashboard, enabling lead quality evaluation according to specific criteria.
Power BI: advanced data visualization
Power BI revolutionizes sales analysis with dynamic visualization capabilities. The platform enables creating interactive dashboards that update in real-time, offering a 360° view of sales performance.
A sales manager can easily connect CRM data and create personalized reports through the intuitive interface. The integrated artificial intelligence feature automatically suggests the best visualizations according to analyzed data type.
The major advantage lies in secure analysis sharing. Teams access dashboards from mobile devices, while managers precisely define access rights per collaborator. An industrial company even reduced reporting time by 40% by centralizing KPIs on Power BI.
Specialized market applications
The market offers dedicated business solutions that address specific sales team needs. These applications combine task automation and advanced analysis customization.
Modern SaaS platforms distinguish themselves through their ability to adapt to each organization's unique sales processes. Lead management is enriched with predictive algorithms to automatically qualify prospects according to purchase potential.
A new generation of tools leverages artificial intelligence to optimize the sales cycle. These solutions analyze buying behaviors, suggest the best sales actions, and support contract renewals through proactive alerts.
Specialized applications excel in daily team support with contextual help features and integrated coaching.
Continuous improvement of your performance
In-depth analysis techniques
Mastering advanced analysis techniques transforms your raw data into genuine sales action levers. Comparative analysis enables performance evaluation between different periods, territories, or customer segments.
The cross-ratio method reveals hidden correlations between your sales indicators. For example, crossing conversion rate with average sales cycle duration highlights sales process optimization opportunities.
Dynamic scoring dashboards enrich your analysis through personalized performance criteria weighting. This approach offers finer result reading and facilitates identifying priority improvement areas for each salesperson.
Sales reporting optimization
Sales reporting modernization relies on intelligent automation of collection and analysis processes. A well-calibrated system reduces report preparation time by 60% on average.
Reports gain clarity through standardized formatting: synthetic graphics, harmonized color codes, and coherent narrative structure. View customization according to recipients strengthens presentation impact.
A services company revolutionized its tracking by creating specialized dashboards by activity type. This targeted approach enables teams to quickly access relevant data for their action scope.
Data update best practices
Dashboard reliability relies on a rigorous update strategy. Daily sales data synchronization guarantees precise real-time performance vision.
A proven method consists of establishing an update calendar adapted to each information type. Sales-related data requires daily updates, while trend analyses can follow weekly rhythm.
A verification protocol strengthens data quality. Source validation, duplicate control, and anomaly correction become natural reflexes for sales teams. A sales manager testifies: "Our error rate dropped by 80% thanks to these systematic controls."
Frequently asked questions
What are the truly essential indicators (KPIs) for a sales dashboard?
Revenue, conversion rate, average basket, number of new clients acquired, and client retention rate.
How can you avoid creating an overly cluttered and illegible sales dashboard?
The sales plan should be reviewed at least quarterly, or whenever a significant market change occurs (new competitor, trend shift, regulatory change).
What simple tools can be used to create a first sales dashboard?
By clearly defining a unique value proposition (USP), identifying differentiating competitive advantages, and communicating them effectively to the target audience.