
The fundamentals of Porter's 5 forces analysis
What is Porter's matrix and its origin
As a professor at Harvard Business School, Michael Porter developed his matrix following extensive research on competitive dynamics in American markets. His objective: create a structured method enabling companies to assess their position against industry players.
The matrix proposes an analysis framework based on measurable key success factors. This innovative approach for its time broke from traditional analyses focused solely on market share and revenue.
Published in his book "Competitive Strategy" in 1980, the matrix quickly became a standard for executives seeking to understand available action levers. Its success stems from its ability to transform complex observations into actionable insights.
Why use the 5 forces model
The 5 forces model represents a powerful strategic tool for decoding your business environment. Its use allows you to anticipate competitor moves and identify development opportunities in your market.
This analysis method reveals available action levers to strengthen your position against established players. For example, in the B2B software sector, analyzing entry barriers helps define a relevant differentiation strategy.
The model highlights untapped value creation zones. You spot segments where customer bargaining power remains weak, enabling precise adjustments to your sales offerings. This deep market understanding transforms your strategic decisions into lasting competitive advantages.
Key principles of the Porter method
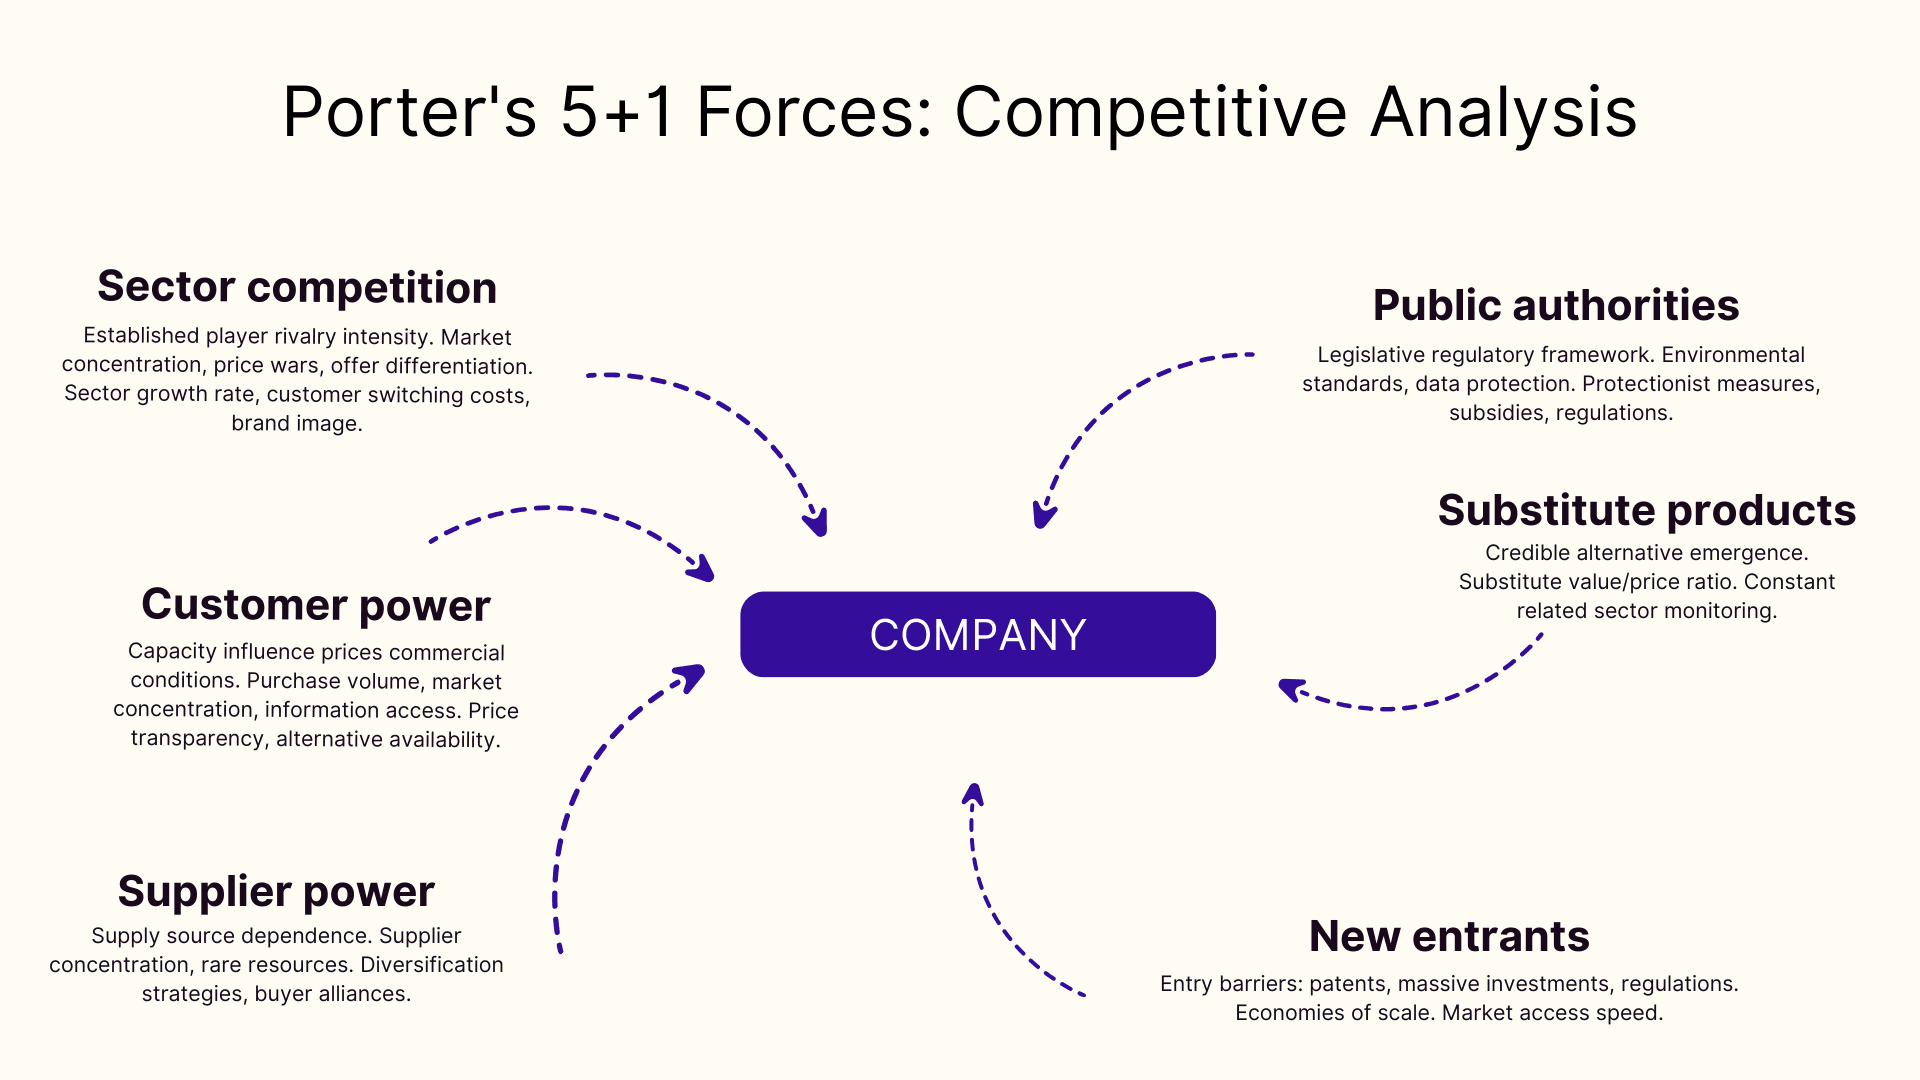
The Porter method revolves around five fundamental forces shaping market dynamics. Each force exerts specific pressure on company profitability and competitiveness.
Take the automotive sector: direct competition between manufacturers is just part of the equation. Parts suppliers, technological innovations from new entrants, and consumer purchasing power equally influence the market.
Mastering these forces requires systematic analysis of each component. A cosmetics manufacturer will evaluate distributor power, scrutinize emerging alternative brands, and anticipate consumption habit changes to adapt their sales strategy.
Detailed analysis of the 5 competitive forces
Current competition intensity
The degree of rivalry between established players determines market profitability. This dynamic is measured through several key factors: company concentration level, price wars, and offer differentiation.
In the B2B software sector, for example, the battle focuses on solution value-added rather than prices. Publishers invest heavily in innovation to stand out against sophisticated competition.
Company maneuvering room varies according to:
- Market growth rate
- Customer switching costs
- Industry exit barriers
- Dominant player brand image
Customer bargaining power
Customers' ability to influence prices and commercial conditions determines their market negotiating strength. This influence varies according to several factors: purchase volume, market concentration, and information access.
A food distributor representing 30% of a manufacturer's sales naturally holds a dominant position in negotiations. Conversely, in a fragmented market where no customer exceeds 5% of revenue, their influence remains limited.
Price transparency and alternative availability also strengthen buyer power. In the automotive sector, online comparators allow customers to easily pit dealers against each other, radically changing the balance of power during negotiations.
Supplier bargaining power
Dependence on supply sources represents a major challenge for company profitability. A single supplier holding rare resources can dictate prices and deadlines, drastically reducing maneuvering margins.
In the semiconductor sector, for example, manufacturer concentration places technology companies in a delicate situation. The 2024 shortage demonstrated direct impact on global electronic device production.
To reduce this vulnerability, companies adopt diversification strategies. Multiplying strategic partnerships and developing alternative solutions help rebalance power relationships. A particularly effective approach involves creating buyer alliances to increase overall order volume.
Threat of new entrants
Market access speed determines risk level for established players. Entry barriers act as natural ramparts: patents, massive initial investments, or strict regulations slow new competitor arrival.
The B2B SaaS sector perfectly illustrates this dynamic. A startup can quickly launch new software with limited resources, while the medical equipment market requires lengthy and costly certifications.
Mastering economies of scale remains a valuable asset against new entrants. An established textile manufacturer benefits from optimized cost structure through production volume, creating a natural financial barrier for emerging brands.
Threat of substitute products
Credible alternative emergence represents a major challenge for any company in 2026. A free video conferencing solution can quickly replace physical meeting services, radically disrupting the business center market.
This threat's strength is measured by substitutes' value/price ratio. A music streaming service like Spotify conquered the market through superior value: unlimited access, advanced personalization, attractive pricing. Facing this transformation, traditional players must constantly innovate.
Substitute anticipation requires constant monitoring, even in related fields. A restaurant must monitor home delivery service growth, while a real estate agency watches direct sales platforms between individuals. This analysis enables strategy adaptation before the threat becomes critical.
The 6th force: public authority influence
Regulatory impact on the market
Regulation profoundly shapes market dynamics in 2026. A strict legislative framework can radically transform game rules, as demonstrated by new European data protection law redefining digital sector commercial practices.
Companies must now anticipate these regulatory changes. Implementing more restrictive environmental standards in the textile industry modifies production costs and pushes brands to rethink their business models.
Permanent regulatory monitoring becomes essential. Companies mastering this parameter transform constraints into strategic opportunities. For example, mandatory environmental labeling allows virtuous companies to promote their responsible commitments to consumers.
Adapting the 5+1 forces model
Integrating strategic elements related to public authorities requires a structured approach. The method involves assessing government decision impact on each existing force.
An automotive manufacturer will see costs increase with anti-pollution standards, while suppliers must modernize equipment. This dynamic modifies negotiation balance.
To maximize model effectiveness, create a specific analysis grid:
- Protectionist measures affecting competition
- Subsidies modifying entry barriers
- Regulations impacting customer-supplier relationships
- Legislation favoring alternative products
Practical application guide for the matrix
Steps to conduct your five forces analysis
Conducting a five forces analysis begins with methodical market data collection. Start by mapping direct competitors and their respective market shares.
Next, decode your value chain. Examine supplier and customer relationships to measure their influence on your margins. A comparative dashboard will help visualize these power relationships.
The third phase involves spotting weak signals announcing new player or alternative product arrival. Scrutinize filed patents, funding rounds, and technological innovations in your sector.
Finalize your analysis by assigning an impact score from 1 to 5 for each force. This scoring will prioritize your strategic actions and optimize resources.
Analysis diagram and table to use
An efficient and simple matrix model is built by placing the 5+1 forces around a central hexagon. This visual representation enables quick reading of interactions between each force. Create an evaluation grid on two axes: intensity (weak to strong) and impact on your activity (minor to major).
For each force, provide measurable indicators. For example, in e-commerce, measure visitor conversion rates to evaluate customer power, or calculate average supply lead time to analyze supplier dependence.
Choose A3 format for your final diagram. This size offers enough space to include observations and quantified data while maintaining a clear and exploitable overview.
Practical exercises with concrete examples
Let's take a real case: a B2B software company facing new competitor arrival. The first step involves mapping current market forces on a blank page. Note prices practiced by direct competitors and their positioning.
Next, evaluate existing customer satisfaction through a quick survey. This approach often reveals unsuspected improvement opportunities. For example, a CRM company discovered its users valued ease of use more than advanced features.
Measure dependence on technological suppliers by calculating cost and time needed to change solutions. A comparative table of alternatives will help you quickly visualize your negotiation margin.
Optimizing your sales strategy with Porter
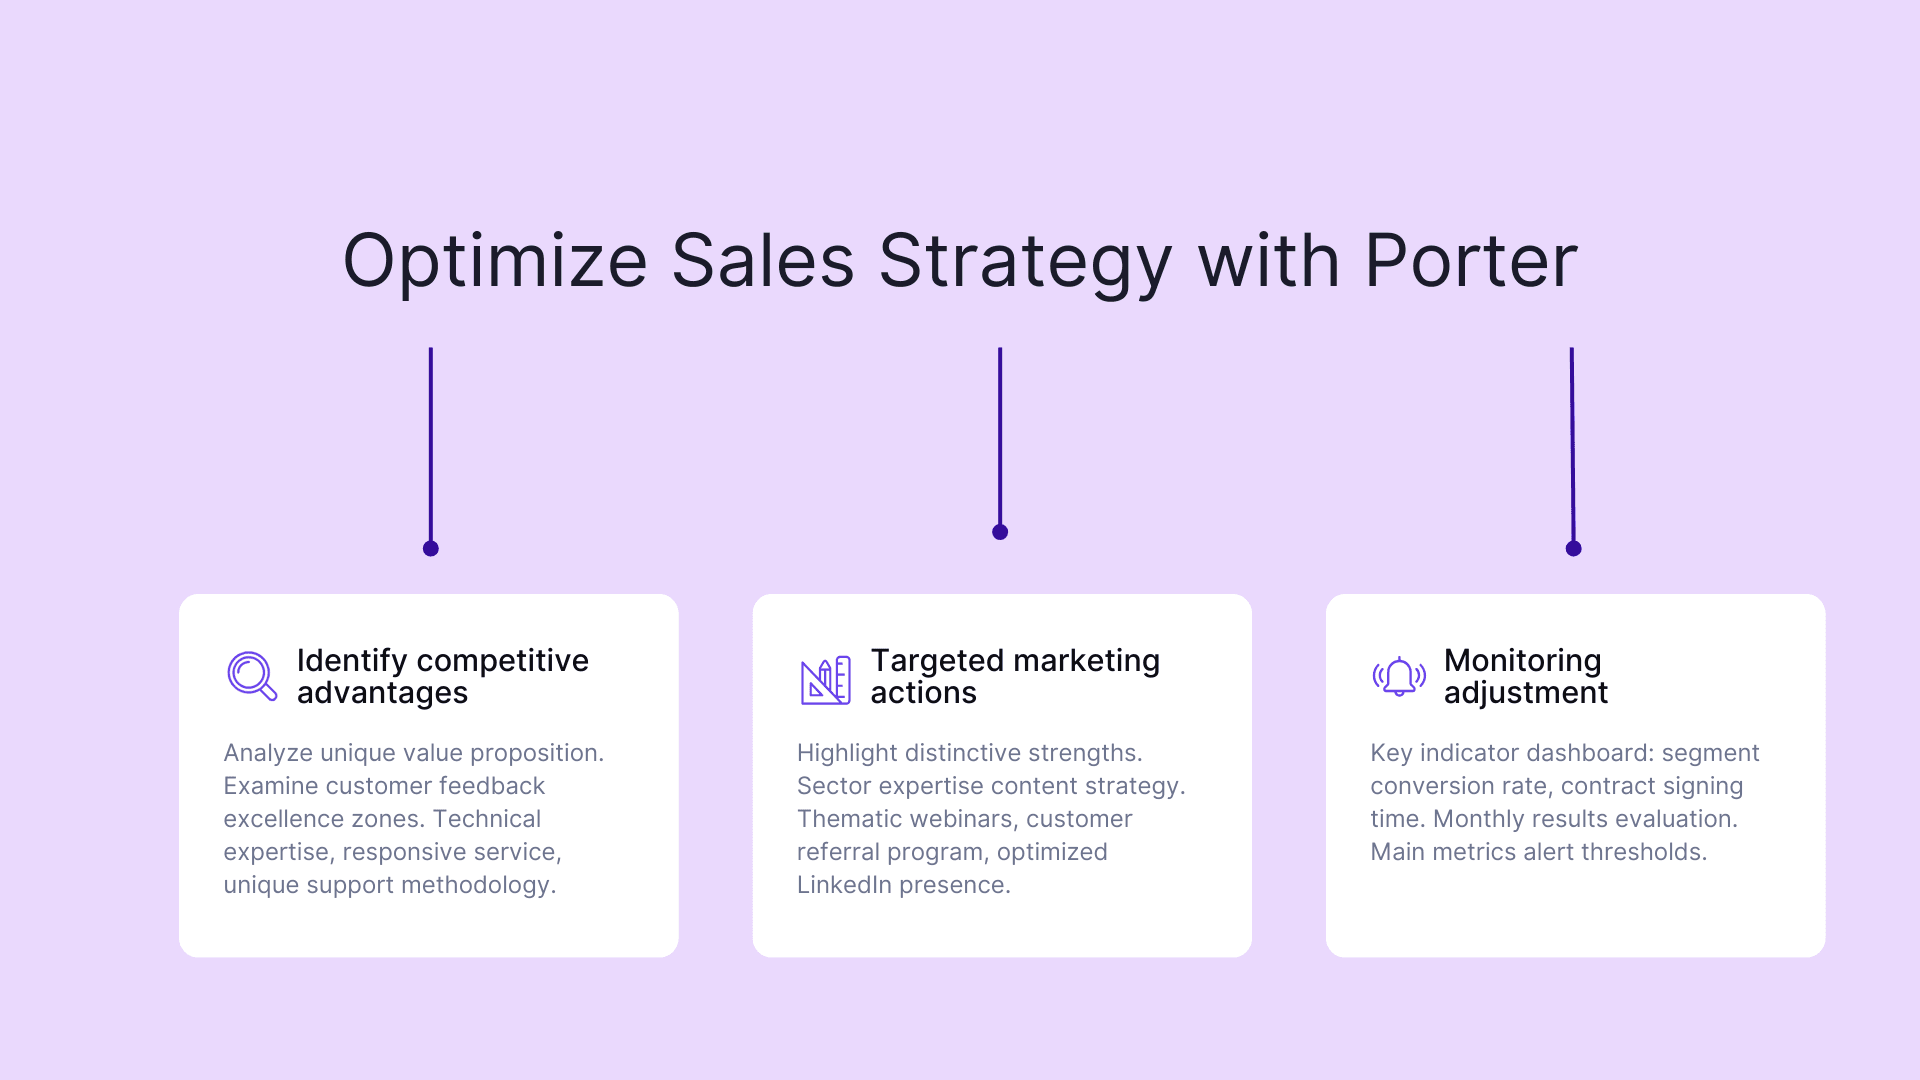
Identifying competitive advantages
Deep positioning analysis reveals your distinctive market assets. Start by examining your unique value proposition: what do you bring that competitors don't offer?
An HR software publisher discovered its major advantage by analyzing customer feedback: its ability to quickly customize modules according to specific company needs. This flexibility allows differentiation against sector giants.
Also scrutinize areas where your company naturally excels. Differentiating factors may reside in technical expertise, reactive customer service, or unique support methodology. For example, specialized expertise in a particular sector represents substantial advantage against generalists.
Marketing actions to implement
Transforming your Porter analysis into marketing actions begins by highlighting your strengths. Create targeted communication campaigns showcasing your unique competitive advantages.
Deploy content strategy based on your sector expertise. A professional blog regularly fed with practical cases reinforces market credibility.
Here are priority actions to maximize impact:
- Develop thematic webinars demonstrating technical mastery
- Implement customer referral program rewarding ambassadors
- Optimize LinkedIn presence with high-value content
Marketing automation industrializes these actions while personalizing customer relationships. For example, a scoring system qualifies prospects according to engagement.
Strategy monitoring and adjustment
A strategic dashboard measures your action effectiveness against competitive forces. Define key indicators like conversion rate by customer segment or average contract signing time.
Conduct monthly evaluation of sales results by comparing performance to set objectives. This analysis reveals areas requiring rapid positioning adjustments.
Adopt proactive approach by establishing alert thresholds on main metrics. For example, a 15% drop in customer renewal rate signals urgent need for offer adaptation against market alternatives.
Model limitations and alternative solutions
Porter analysis strengths and weaknesses
Porter model's main strength lies in its ability to structure systematic market analysis. Its methodical framework guarantees comprehensive competitive environment examination without forgetting critical aspects.
The matrix particularly shines in traditional sectors where game rules remain stable. An automotive manufacturer can easily map direct competitors and their respective positioning.
Its limitations appear facing emerging markets characterized by disruptive innovations. In the technology sector, boundaries between competitors and partners become blurred, making analysis more complex. The matrix also struggles integrating collaborative dynamics like innovation ecosystems or multi-sided platforms.
Complementarity with other strategic tools
Strategic tool combination enriches your global diagnosis. PESTEL analysis brings valuable macro-environmental vision, while BCG matrix evaluates product portfolio performance.
To maximize analysis effectiveness, structure your approach:
- Use SWOT for comprehensive situation overview
- Apply Ansoff matrix to identify growth axes
- Leverage Business Model Canvas to visualize economic model
This multi-tool approach enables 360° positioning analysis. A software solution manufacturer can, for example, combine Porter and PESTEL to anticipate new legislation impact on their market.
Frequently asked questions
What are the main objectives of using Porter's matrix?
Understanding a sector's competitive structure, identifying direct and indirect competitors, and spotting market opportunities and threats.
Is the "6th force" (public authority influence) always part of Porter's analysis?
Porter's Five Forces, SWOT analysis, competitor benchmarking, and market mapping are among the most widely used frameworks.
Is Porter's matrix still a relevant tool for today's companies?
Ideally on an ongoing basis with a thorough annual review, but also whenever there's a major market event (new entrant, merger, regulation change).