Sales forecasting fundamentals in 2025
What is sales forecasting today?
Sales forecasting in 2025 is transforming into a dynamic process based on real-time commercial data analysis. Modern companies now combine human expertise with sophisticated predictive models to maximize their accuracy.
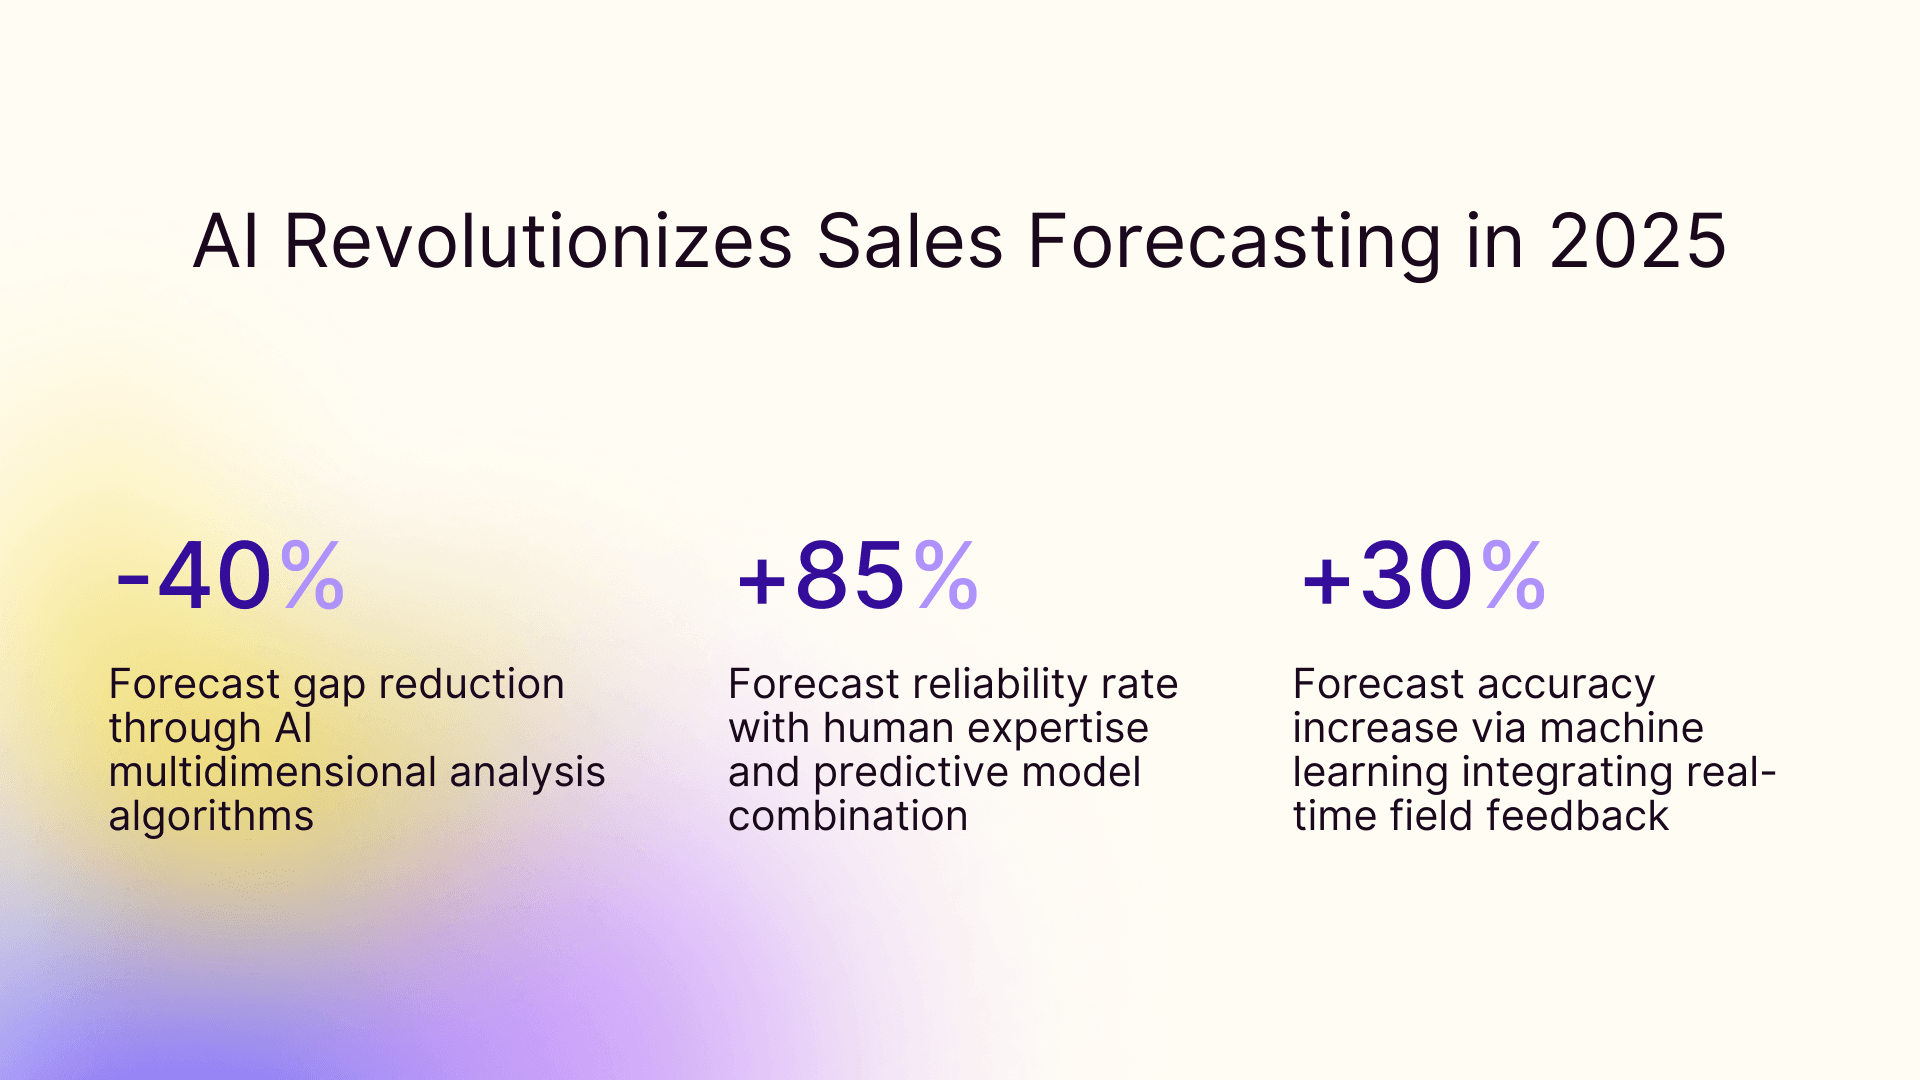
A concrete example: a B2B company simultaneously analyzes its sales funnel, conversion probabilities, and market evolution to adjust its monthly projections. This approach achieves reliability rates exceeding 85%.
Smart dashboards facilitate better decision-making by automatically consolidating historical data, external factors, and current trends. Sales teams can thus adapt their strategy quickly, transforming forecasting into a true commercial performance lever.
The stakes of reliable forecasting
Reliable forecasting constitutes a strategic lever for company growth. Leadership teams rely on this data to plan their investments and optimize their cash flow.
Precise anticipation of sales cycles allows for timely adjustment of human and material resources. For example, a food distributor that forecasts a 30% increase in activity can recruit and train its teams two months before the demand peak.
Budget decisions rest on the quality of commercial projections. A 5% margin of error in forecasts can represent hundreds of thousands of dollars in variation on the final result. Mastering this indicator becomes a major competitive advantage in a constantly changing market.
The role of the sales forecasting manager
The sales forecasting manager acts as a conductor between different company departments. Their primary mission consists of analyzing historical data and market trends to establish precise projections.
A concrete example: in a B2B tech company, this professional coordinates with marketing to evaluate campaign impact on expected sales volume. They also collaborate with production to guarantee capacity adapted to activity peaks.
Success in this role rests on a unique combination of analytical and relational skills. The manager must master modern statistical tools while knowing how to communicate their analyses to field teams. Their ability to transform raw data into actionable insights guides the company's commercial strategies.
Main commercial forecasting methods
The extreme points method explained
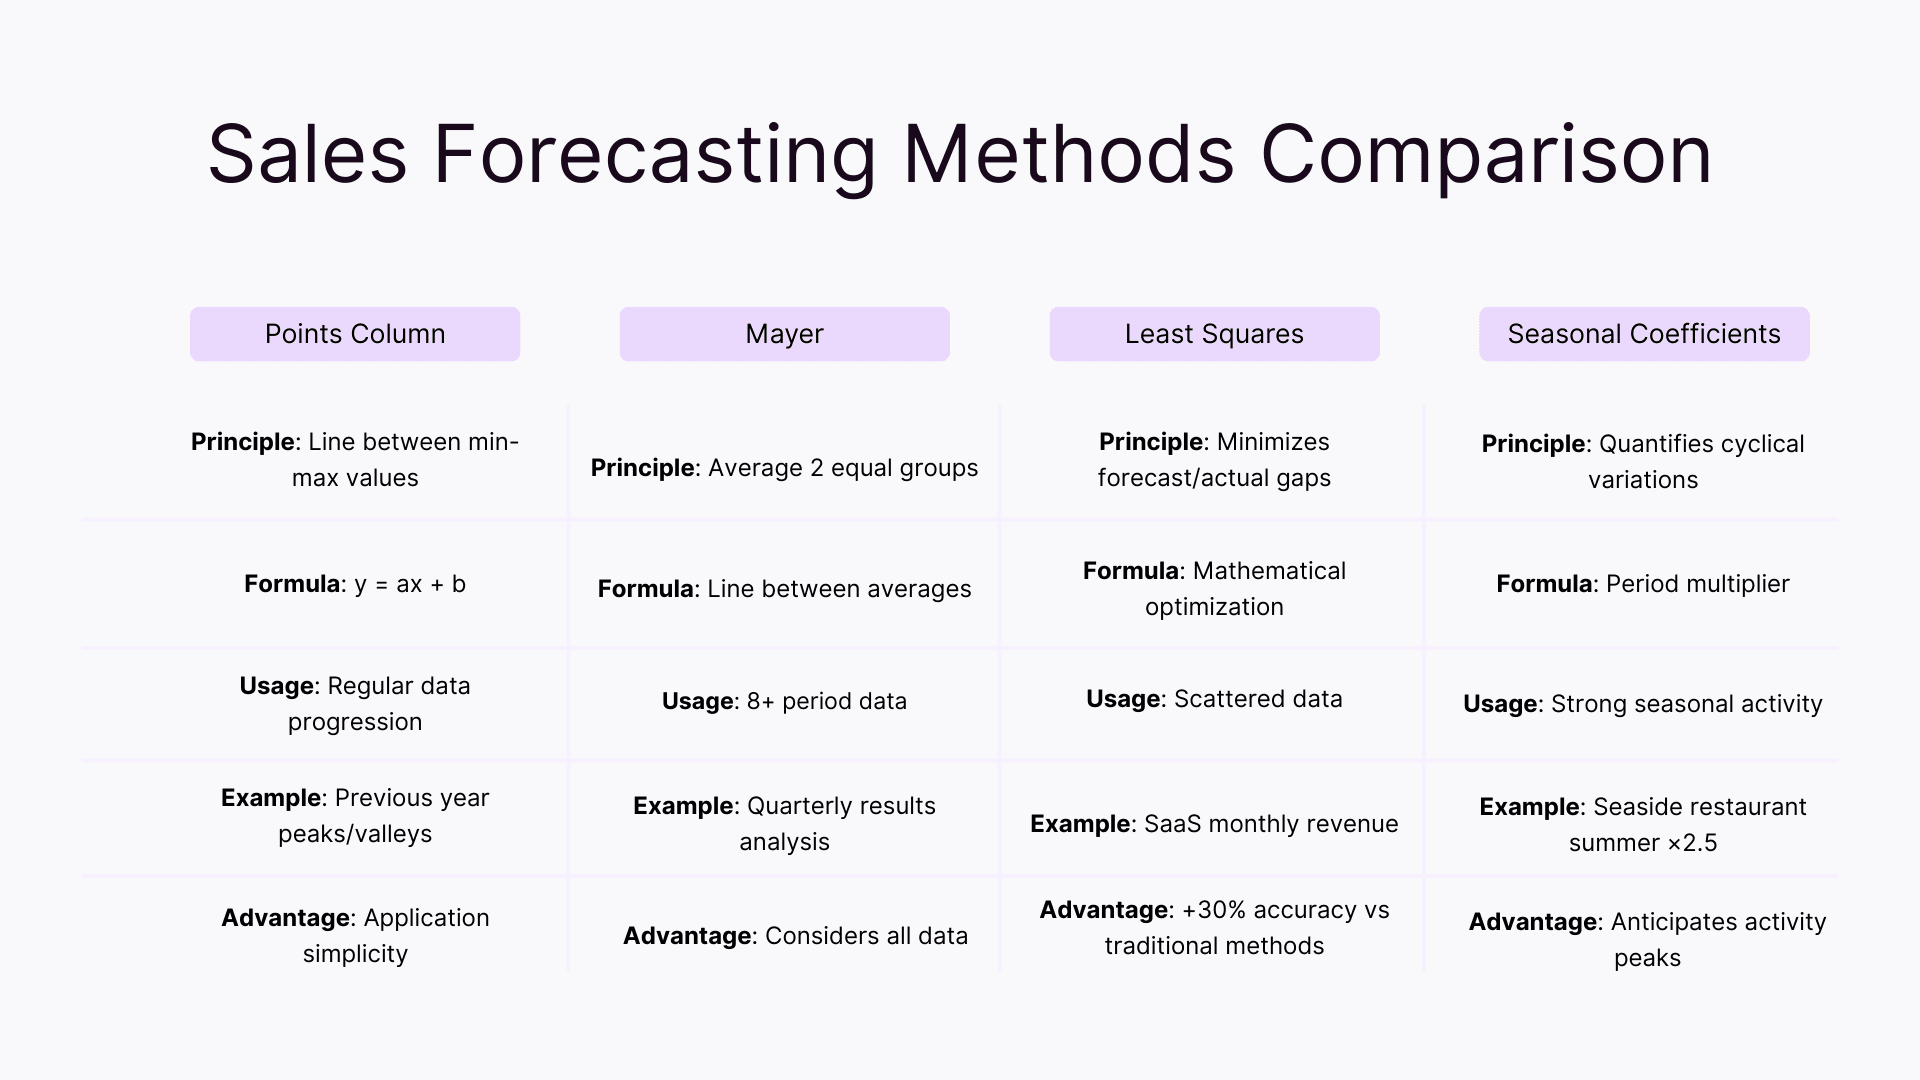
The extreme points method stands out for its simplicity in establishing sales forecasts. This mathematical technique relies on analyzing minimum and maximum values in a chronological series.
To apply it, start by identifying the two extreme points in your sales series. Then draw a line connecting these points to obtain a linear trend. The mathematical formula y = ax + b allows you to calculate realistic objectives for upcoming periods.
This approach works particularly well when your data follows regular progression. A car salesman uses it, for example, to anticipate monthly sales based on the previous year's peaks and valleys.
Mastering the Mayer method step by step
The Mayer method relies on calculating average points to establish reliable projections. Its application requires dividing your data into two equal groups. For example, for a sales series over 8 years, you create two groups of 4 years each.
The power of this approach lies in its ability to consider all available data. A tech company sales manager uses it to analyze quarterly results: by separating data into two periods, they obtain a precise vision of their growth trajectory.
To maximize its effectiveness, calculate the average of each group, then draw the line connecting these two points. This line becomes your forecasting model for upcoming periods.
The least squares approach in detail
The least squares method represents a sophisticated mathematical tool for establishing precise commercial forecasts. Its principle? Minimize the gap between actual and predicted values, guaranteeing optimal reliability even with scattered data.
A SaaS company sales director uses this method to anticipate monthly revenue. By analyzing revenue variations over 24 months, they obtain projections 30% more accurate than with traditional methods.
The strength of this approach lies in its ability to integrate each historical data point into the calculation. Modern management software automates these complex calculations, transforming a mathematical formula into a strategic tool for your commercial development.
Using seasonal coefficients
Seasonal coefficients represent a strategic asset for refining your commercial forecasts. A seaside restaurant exploits this technique to anticipate activity peaks: its summer revenue reaches 2.5 times the annual average.
The power of this approach lies in its ability to precisely quantify cyclical variations in your activity. For example, a toy store calibrates its inventory knowing that December systematically generates a sales multiplier of 3.2 compared to its monthly average.
To maximize its effectiveness, combine historical data analysis with emerging trends. An air conditioning salesman adjusts coefficients by integrating the growing impact of early heat waves on spring sales.
Calculating your sales forecasts efficiently
Essential Excel formulas
The FORECAST.LINEAR function stands as the basis for forecasting calculations in Excel 2025. An IT services company uses it to project monthly sales with only a 12% margin of error.
Experts also recommend the FORECAST.ETS formula, which automatically integrates seasonal variations. An industrial equipment distributor applies it by combining 24 months of historical data with commercial objectives.
To refine your analyses, exploit these three complementary formulas:
- GROWTH: analyzes exponential sales evolution
- TREND: determines the general market direction
- SMOOTHING: reduces random data variations
Creating a high-performance forecasting table
Designing an effective forecasting table relies on clear and methodical structure. Start by creating three essential columns: period, historical data, and projections. This organization guarantees smooth information reading.
A tech company sales manager optimizes their table by adding a conversion rate column per prospect. This approach allows them to refine forecasts based on their sales pipeline quality.
Think about integrating dynamic charts that update automatically. For example, a curve diagram visualizes trends, while a histogram compares monthly results to objectives. This visualization transforms your raw data into true decision-making tools.
Practical exercises and concrete cases
Let's move to practice with a real commercial projection exercise. Take your last quarter's sales and apply the moving averages method over a 4-week period.
A computer equipment salesman recently used this technique to anticipate activity peaks. Result: a 25% increase in available inventory during strategic periods.
Then project your results over 3 months by integrating seasonal variations. For example, a fashion boutique adjusts its calculations based on sales periods, multiplying its projections by 2.5 during these specific periods.
The key lies in meticulous analysis of gaps between forecasts and achievements. This approach allows for progressive refinement of your future estimations' accuracy.
Optimizing forecast reliability rates
Essential KPIs to monitor
A high-performance dashboard relies on three strategic indicators to guarantee forecast reliability. The accuracy rate measures the gap between projections and achievements, with an excellence threshold set at 85% in B2B sectors.
Conversion velocity reveals the pace of transforming opportunities into concrete sales. A digital services company improved its profitability by 23% by monitoring this indicator over 12 months.
The lead qualification score completes this winning trio. This metric evaluates prospect quality based on their buying behavior and engagement. An industrial distributor uses this KPI to concentrate efforts on opportunities with potential exceeding 70%.
Analyzing forecast gaps
Mastering forecast gaps relies on structured analysis methodology. Start by identifying the nature of gaps: are they related to sales volume, practiced prices, or product mix composition?
A sales manager benefits from categorizing gaps by their origin. External factors like competitive actions or market variations are distinguished from internal factors such as commercial performance or product availability.
Establish a monthly analysis grid with three priority levels:
- Critical gaps requiring immediate action
- Significant variations to monitor
- Minor deviations to note
This pragmatic approach transforms gap analysis into a true tool for continuous improvement of your commercial forecasts.
Real-time adjustment techniques
Modern commercial agility requires instant forecast adjustment capability. A technology company sales manager has implemented an automatic alert system that triggers as soon as a 15% gap appears between forecasts and achievements.
Reactivity passes through dynamic updating of field data. For example, industrial equipment salespeople synchronize their visit reports via a mobile application, allowing daily objective recalibration.
Collaborative forecasting transforms each team member into an information sensor. A digital services company increased its forecast accuracy by 30% by integrating qualitative feedback from its support teams into its predictive model.
Modern sales forecasting tools
Comparison of the best market software
The market offers innovative solutions adapted to each activity sector. Modern platforms distinguish themselves by their automatic learning capability, allowing forecast refinement over time.
A furniture manufacturer increased its forecast accuracy by 40% thanks to software integrating weather data and seasonal trends. The key lies in choosing an interface adapted to your needs: some solutions prioritize ease of use, others excel in deep analysis.
Decisive criteria for your selection:
- Dashboard ergonomics
- Graphic visualization quality
- Update frequency
- Report customization level
Machine learning solutions for forecasting
Machine learning radically transforms the forecasting approach by analyzing thousands of variables simultaneously. A food distributor exploits this technology to anticipate consumption variations based on weather, local events, and social trends.
The power of predictive algorithms lies in their ability to detect complex patterns invisible to the human eye. For example, a neural network can identify subtle correlations between buying behavior and external factors like news or social media.
These models adapt permanently through continuous learning. A fashion company uses this agility to adjust its forecasts daily based on customer reactions to new collections.
Real-time data integration
Real-time data synchronization revolutionizes commercial forecast accuracy. A dynamic dashboard now centralizes essential information: buying behaviors, inventory levels, and commercial performance.
A distribution company improved its forecasts by 25% by connecting its CRM to its e-commerce site data. This approach allows rapid anticipation of demand variations and commercial strategy adaptation.
The key lies in the quality of connectors feeding the predictive system. An automotive manufacturer synchronizes, for example, its dealership data with market trends to adjust daily objectives. This increased reactivity strengthens commercial decision relevance.
Pipeline vs forecasts: understanding the differences
Comparative analysis of both approaches
The commercial pipeline focuses on tracking current opportunities, while sales forecasts project future results. A wise sales manager uses these two tools complementarily to maximize their success rate.
The pipeline's strength lies in its ability to visualize each sales process stage, from first contact to signature. Forecasts, on the other hand, rely on statistical analyses to anticipate upcoming performance.
A practical example: a digital services company tracks its qualified leads in its pipeline to guide daily actions, but exploits its forecasts to plan long-term recruitment and investments. This dual approach guarantees a 360° vision of commercial activity.
Synchronizing pipeline and forecasts
Successful synchronization between deal tracking and future projections relies on a unified dashboard. This approach allows salespeople to simultaneously feed their prospecting data and forecast estimations.
A dynamic scoring system assigns probability coefficients to each opportunity based on its maturity. For example, a commercial proposal sent over 30 days ago without response will see its weighting automatically adjusted in forecast calculations.
Modern tools facilitate this synchronization by offering automatic updates. A salesperson can thus modify a negotiation status and instantly see the impact on monthly objectives, guaranteeing perfect coherence between field activity and results anticipation.
Case study: real estate forecasts 2025
Real estate market trends
The French real estate market shows encouraging signs in spring 2025. The interest rate decline, now below 3%, stimulates buyer return to the market. Transactions resume their dynamism with an annual forecast of 900,000 sales.
Prices show stabilization in major metropolitan areas, while medium-sized cities record a slight 2% increase. This new market dynamic requires rapid adaptation of professional commercial strategies.
New energy standards are also reshaping the real estate landscape. Renovated properties gain attractiveness, creating a promising segment for sellers who anticipate this market transformation.
Sector-specific methods
Real estate agents rely on advanced indicators to refine their forecasts. Analysis of average selling times per neighborhood allows precise anticipation of future price variations.
Tracking credit requests with brokers constitutes an excellent activity barometer. This method reveals purchase intentions 2 to 3 months before their materialization.
Professionals also monitor behavioral data from real estate portals: time spent on listings, virtual visit numbers, favorite rates. A Parisian agency thus predicted a house-with-garden transaction increase by cross-referencing this data with buyer searches.
Training and skill development
Available resources and certifications
Current professional certifications in sales forecasting come in several levels. The RNCP "Commercial Forecaster" certification validates deep expertise in sales predictive analysis.
A rich catalog of digital resources accompanies your skill development. Platforms like FranceCompétences offer specialized modules in data visualization and statistical modeling.
Commercial managers favor mixed training: face-to-face for analytical tool mastery, distance learning for forecasting methodology learning. A distribution company trained 80% of its teams via this hybrid format in 2024.
Free monthly webinars help stay updated on the latest innovations in commercial forecasting.
Corrected PDF exercises for download
Our practical exercise pack provides 12 real sales forecasting cases. Each exercise offers concrete situation implementation, accompanied by detailed corrections explaining the step-by-step approach.
Covered themes encompass all modern techniques: seasonal trend analysis, standard deviation calculation, sales projection by client segment. A computer equipment salesman improved his forecast accuracy by 25% after applying these exercises.
You'll discover notably:
- Predictive analysis with real market data
- Price-volume elasticity calculations
- B2B sales cycle modeling
Future perspectives of sales forecasting
AI impact on forecasting methods
Artificial intelligence revolutionizes forecasting methods in 2025 thanks to its multidimensional analysis capability. Advanced algorithms now scrutinize buying behaviors while integrating seasonal variations, market trends, and weak signals.
A distribution company reduced its forecast gaps by 40% by combining historical data and predictive analyses. AI now anticipates demand peaks 3 weeks in advance, allowing optimal inventory adjustment.
Modern predictive systems surpass simple statistical analysis. They automatically detect correlations between marketing campaigns, potential customer behavior, and market variations, transforming each data point into a commercial optimization lever.
Forecasting tool evolution
Forecasting tool interfaces are radically transforming to offer users a more natural experience. Interactive dashboards replace traditional spreadsheets, allowing dynamic visualization of commercial trends.
The new generation of tools focuses on repetitive task automation. Salespeople now dedicate their time to strategic analysis rather than manual data entry. Reports generate automatically and adapt to each user's profile.
Particular emphasis is placed on mobility and collaboration. Teams access forecasts from their smartphones and share observations in real-time via collaborative workspaces. This participative approach enriches projection quality while strengthening team adherence to set objectives.
Frequently asked questions
What is the simplest sales forecasting method for beginners?
The extreme points method is simple, based on minimum and maximum observed values. However, it can be less precise than least squares regression, especially with scattered data.
How can one improve their sales forecast reliability?
It uses only the two extreme points (highest and lowest) to draw a trend line, while least squares considers all data points for a statistically more robust calculation.
Are sales forecasting software essential for a company?
It's useful for quick sales forecasting, trend estimation from limited data, and as a first approximation before applying more sophisticated statistical methods.