The Fundamentals of Monthly Recurring Revenue
What Is MRR (Monthly Recurring Revenue)?
Monthly Recurring Revenue represents the sum of predictable revenue a company generates each month through its subscriptions and recurring services. For instance, a company offering three plans at $50, $100, and $200 per month with 10 customers on each plan has an MRR of $3,500.
This standardized amount excludes one-time revenues like setup fees or unique services. Its strength lies in its ability to provide a clear view of monthly financial performance.
For a B2B company, MRR acts as a compass to anticipate growth, assess the health of its customer base, and adjust its business strategies in real-time — especially when combined with metrics like ARR and ARPU.
The Importance of Recurring Metrics in B2B
Recurring metrics form the foundation of a successful B2B business strategy. Regularly measuring MRR helps anticipate resource needs, optimize sales cycles, and quickly detect warning signs.
Precise tracking of recurring revenue facilitates strategic decisions about allocating marketing budgets or product development. Companies that master their metrics increase their ability to retain existing customers while identifying the best expansion opportunities — a core challenge of B2B sales professions.
MRR also serves as a barometer to evaluate the impact of new features or pricing changes on customer satisfaction. This data-driven approach strengthens credibility with potential investors and partners.
MRR vs. ARR: Understanding the Differences
MRR reflects the monthly dynamics of your business, while ARR provides a comprehensive annual perspective. A clear example: a SaaS startup billing $1,000 per month to 10 clients records an MRR of $10,000 and an ARR of $120,000.
The granularity of MRR makes it easier to quickly detect revenue fluctuations and make short-term tactical adjustments. ARR, on the other hand, is more useful for strategic forecasting and communication with investors.
Mature companies often prefer ARR for its stability and macro view, while growing startups rely on MRR to drive their daily inbound sales activities.
Calculating MRR: Methodology and Best Practices
The Basic Formula for Calculating MRR
The fundamental MRR formula is based on a simple equation: MRR = Total Number of Active Customers × Average Monthly Revenue per Customer.
This mathematical approach can be adapted to your billing model. For annual subscriptions, divide the amount by 12 before including it in the calculation.
A practical example: a company has 25 customers on a $150 monthly plan and 15 customers on a $1,440 annual plan. The calculation becomes: (25 × $150) + (15 × $120) = $5,550 in MRR.
For accurate tracking, update this calculation on a fixed date each month, excluding non-recurring revenues like setup fees or one-time services.
The Components to Include in Your Calculator
An effective MRR calculator integrates five essential components: revenue from basic subscriptions, revenue from premium features, revenue from recurring add-on services, permanent discounts, and seasonal adjustments.
Consider a B2B document management platform: the standard subscription brings in $200/month, premium modules generate an additional $100, and dedicated support adds $50/month per customer. Loyalty discounts reduce the total by 10%.
To maximize the accuracy of your calculation, create distinct categories in your dashboard:
- Standard subscription revenue
- Premium option revenue
- Recurring service revenue
- Total discount amount
- Seasonal adjustments
Common Calculation Errors to Avoid
The primary source of inaccuracy is including non-recurring revenue. Setup fees, one-time services, or initial training must be excluded from the MRR calculation.
Another common mistake involves mixed billing cycles. Companies sometimes forget to correctly convert annual subscriptions into their monthly equivalent, which skews the results.
Temporary adjustments like promotional discounts or free trial periods present another challenge. These one-time variations do not reflect actual recurring revenue and require specific handling in your calculation.
The Different Types of MRR for Your Business
New MRR: The Acquisition of New Customers
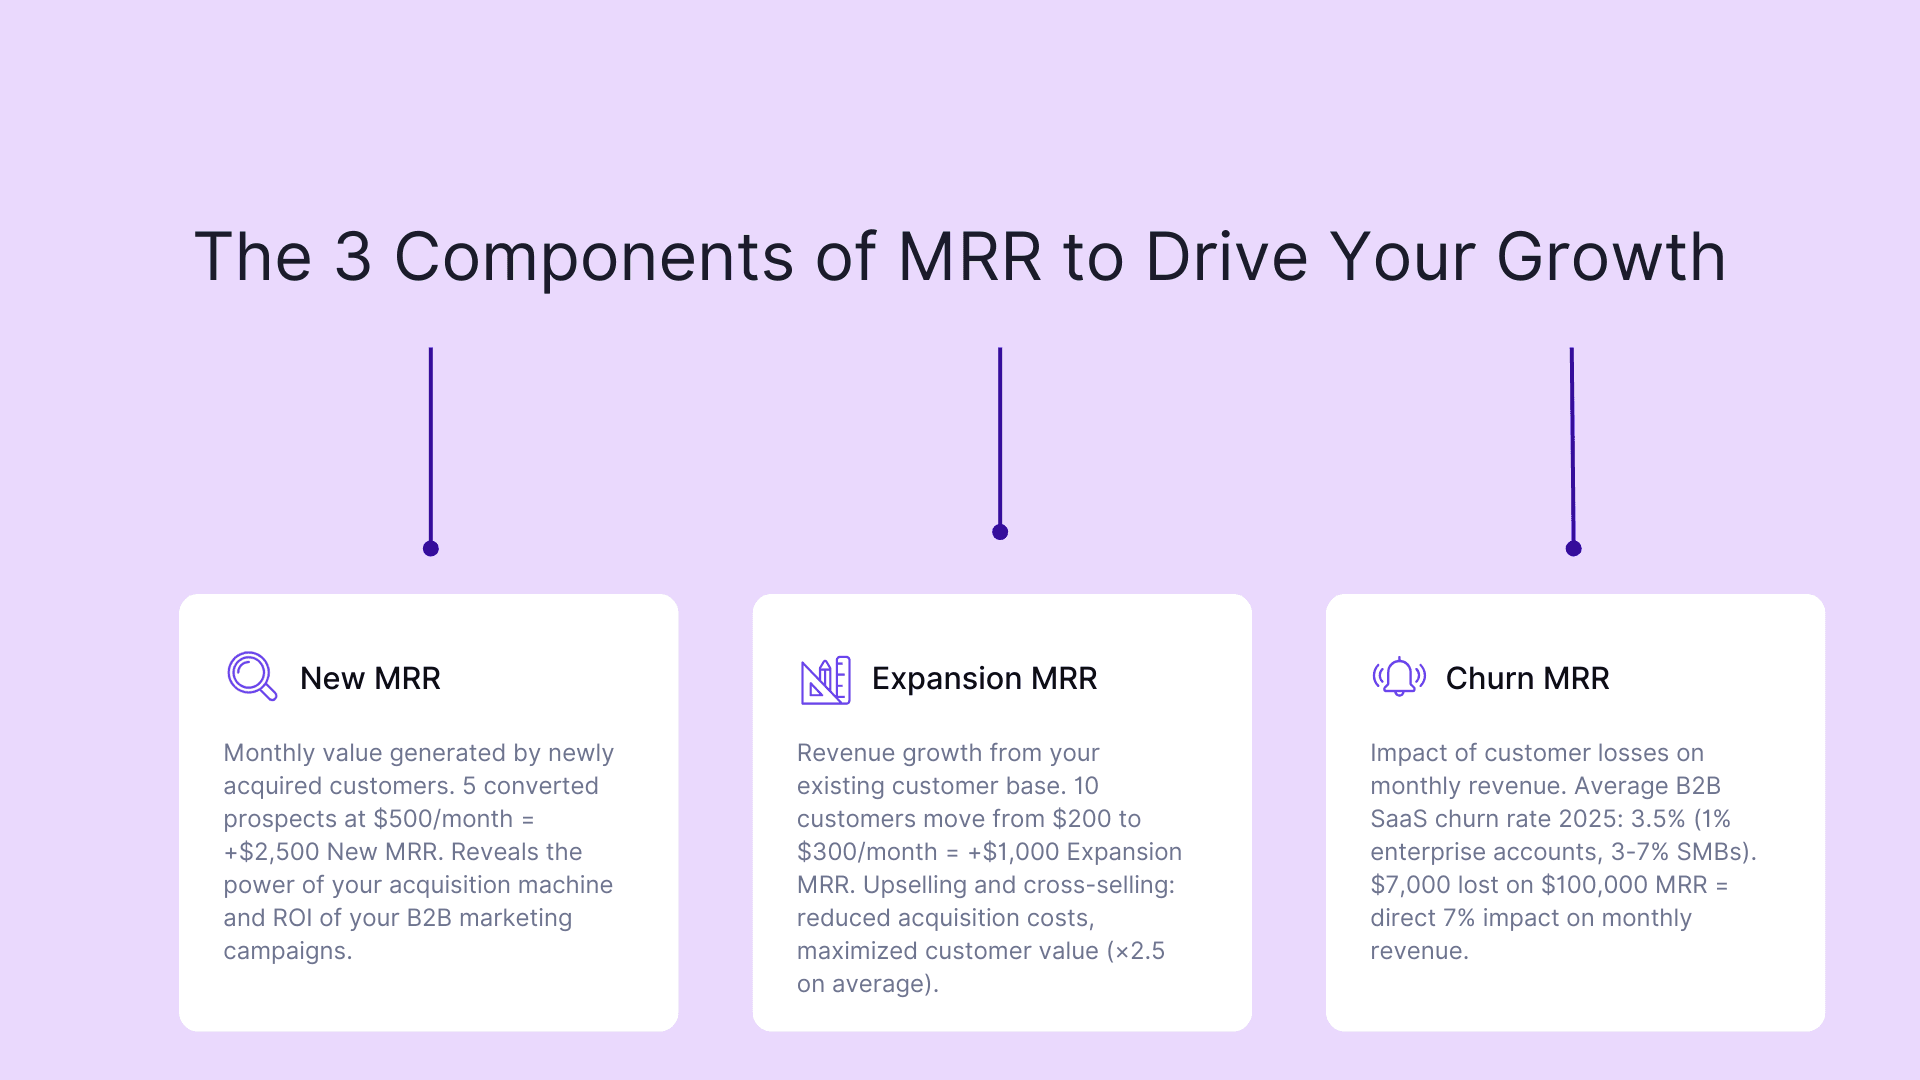
New MRR represents the monthly value generated by your newly acquired customers. A sales director who converts 5 prospects at $500 per month each instantly adds $2,500 to their New MRR. This metric reveals the power of your acquisition machine.
Measuring New MRR allows you to precisely evaluate the return on your B2B marketing campaigns. A 20% improvement in the conversion rate of your qualified leads directly translates to a proportional increase in this recurring revenue.
To optimize your New MRR, focus on two levers: rigorous prospect qualification and tailoring your offer to the specific needs of each market segment. This targeted approach ensures better-qualified customers and more stable recurring revenue.
Expansion MRR: The Growth of Existing Customers
The Expansion MRR strategy relies on increasing the revenue generated from your current customer base. A salesperson who upgrades 10 customers from a $200 standard plan to a $300 premium plan instantly creates an additional $1,000 in Expansion MRR.
Upselling to satisfied customers drastically reduces acquisition costs while maximizing customer value. A B2B SaaS company that multiplies its revenue by 2.5 through cross-selling demonstrates the effectiveness of this approach.
Success depends on two tactics: proactively identifying upgrade opportunities by analyzing usage, and creating add-on modules that meet the specific needs of the most promising segments.
Churn MRR: The Impact of Customer Losses
The average churn rate in the B2B SaaS sector reaches 3.5% in 2025, with a marked distinction based on company size. Enterprise accounts show a monthly churn close to 1%, while the SMB segment hovers between 3% and 7%.
MRR loss from churn is broken down into two categories: voluntary churn (2.6%) when a customer actively decides to leave, and involuntary churn (0.8%) caused by technical or payment issues.
To illustrate the financial scale: a SaaS with $100,000 in MRR that loses $7,000 due to cancellations and downgrades suffers a direct 7% impact on its monthly revenue. This data highlights the urgency of establishing a robust retention strategy.
Optimizing Your Recurring Revenue Model
Growth Strategies to Increase MRR
Advanced customer segmentation paves the way for personalized MRR growth tactics. Analyzing usage data helps identify the most promising segments and tailor offers accordingly.
A winning approach is to create automated product evolution paths. When a customer reaches 80% of their current usage limits, an alert system triggers relevant upgrade suggestions, maximizing the chances of conversion.
A product adoption program is another powerful lever. Training your customers to fully leverage advanced features strengthens their engagement and naturally encourages their progression to higher-tier plans. For example, a customer who masters API integration will be more inclined to subscribe to premium modules.
Pricing Policy and Its Impact on MRR
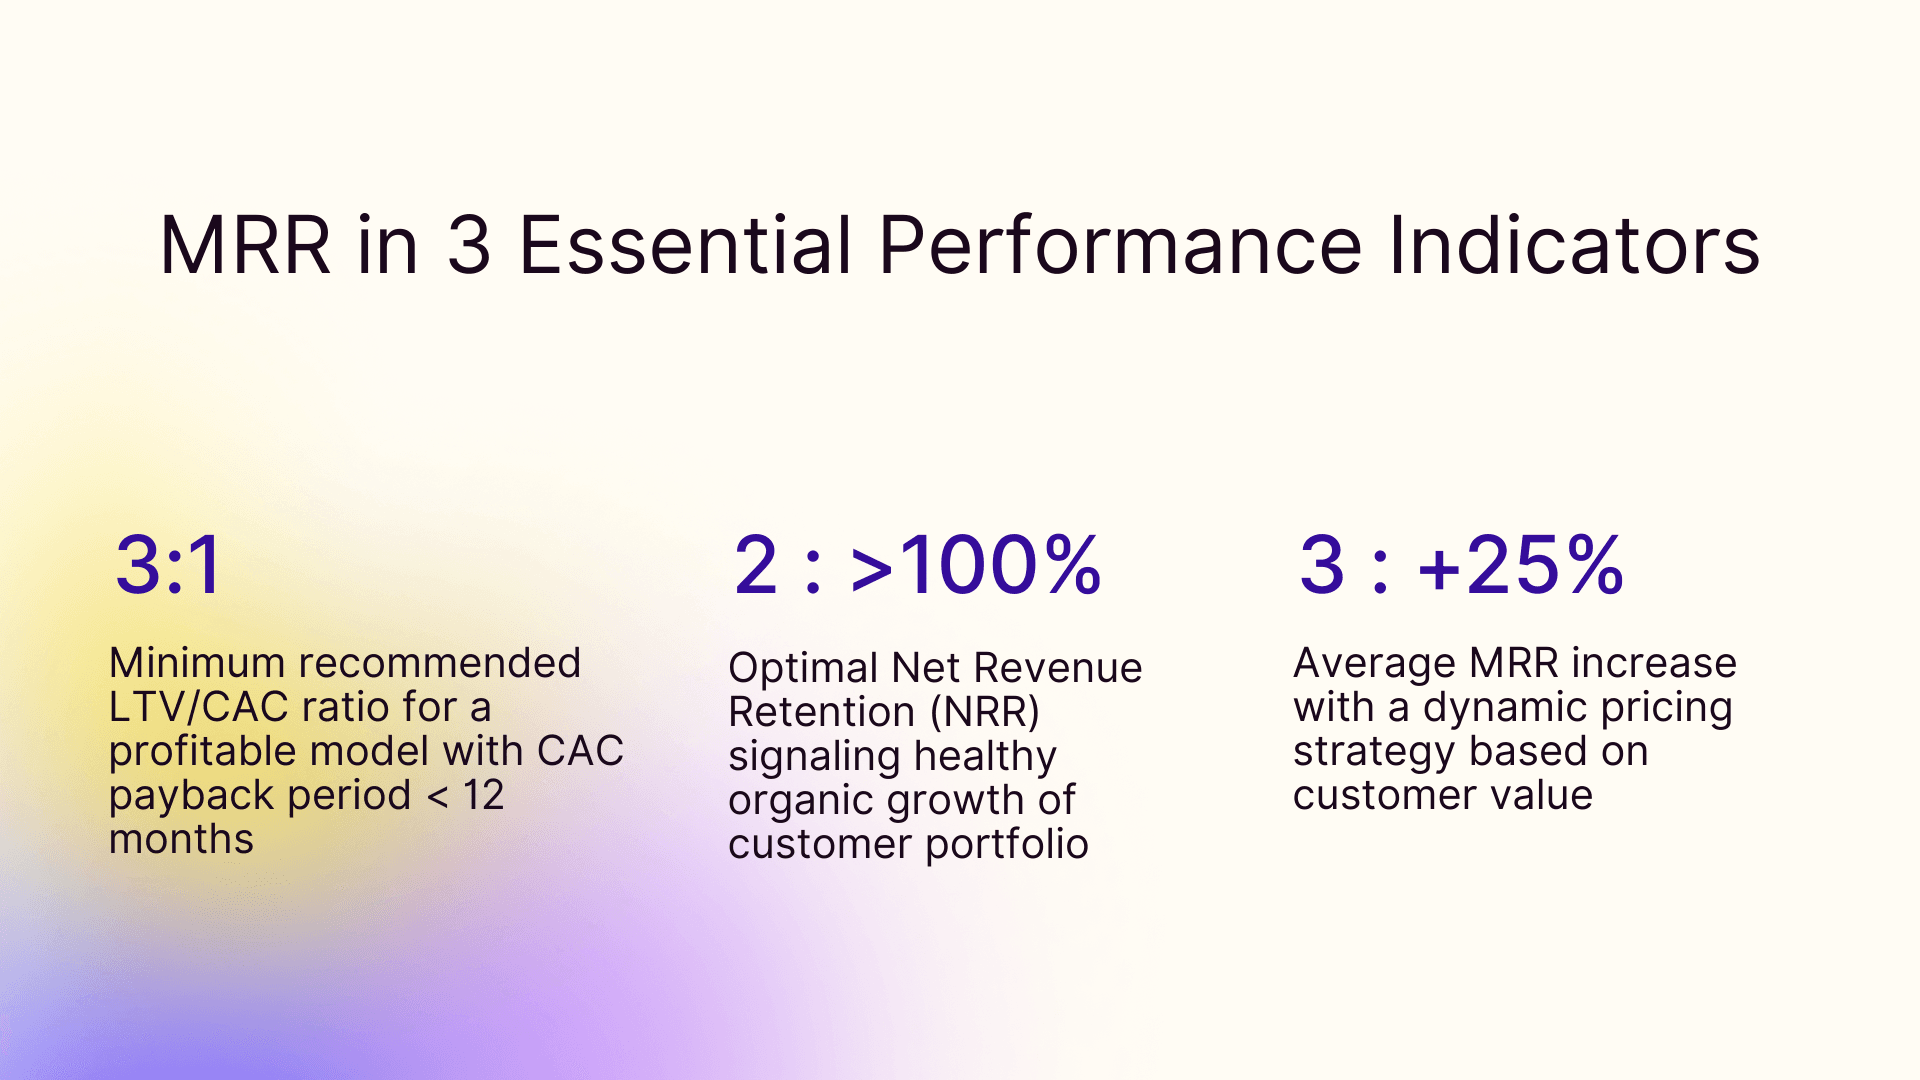
A dynamic pricing strategy can significantly increase MRR. Companies that apply value-based pricing see an average 25% increase in their monthly recurring revenue.
Implementing a hybrid model, combining a fixed subscription with usage-based billing, meets the market demands of 2025. This pricing flexibility promotes customer engagement while securing a predictable revenue base.
Tiered pricing that evolves with the actual use of features naturally encourages progression to higher plans. For instance, a B2B SaaS company that adopted this model saw its average revenue per customer increase by 40% over 6 months.
Essential KPIs to Monitor
The Net Revenue Retention Rate (NRR) measures the ability to generate additional revenue from your existing customer base. An NRR greater than 100% signals healthy organic growth in your portfolio.
The average contract length reveals the strength of your customer relationships. For high-performing B2B SaaS companies in 2025, this metric exceeds 36 months.
Also, monitor the LTV/CAC ratio, which determines the profitability of your business model. Best practices recommend a minimum ratio of 3:1, with a CAC payback period of less than 12 months.
A customer satisfaction rate (CSAT) above 85% combined with a positive NPS confirms the added value of your solution and predicts a natural expansion of MRR.
MRR as a Marketing Performance Indicator
Analyzing the Performance of Acquisition Channels
Segmenting by acquisition channel reveals significant differences in MRR generation. A dedicated dashboard allows you to visualize the contribution of each source: inbound marketing, direct sales, partnerships, or marketplaces.
Comparative analysis shows that in 2025, B2B leads from content marketing generate an average MRR that is 30% higher than other channels. This performance is explained by better upstream qualification and a deeper understanding of customer needs.
Implementing an acquisition score by channel helps identify the most profitable sources. For example, a B2B SaaS company discovered that its themed webinars converted twice as well as its advertising campaigns, while also generating a higher initial MRR.
Measuring the ROI of Digital Marketing Actions
Mastering the calculation of marketing ROI involves setting quantifiable objectives for each campaign. A unified dashboard centralizes essential data: acquisition costs, average contract value, and engagement duration.
Analyzing the conversion cycle establishes the direct link between marketing investments and MRR generation. For example, a web marketing campaign that cost $10,000 and resulted in 5 new contracts with a monthly value of $1,000 each demonstrates its profitability in just 2 months.
The multi-touch attribution methodology identifies the real contribution of each touchpoint in the buyer's journey. This approach ensures an optimal allocation of resources to the actions generating the best return on investment.
Finance and Forecasting Based on MRR
Building Reliable Financial Projections
The accuracy of financial forecasts relies on a fine-grained segmentation of MRR by customer category. A robust model incorporates seasonal variations and distinguishes stable revenue from multi-year contracts from more volatile monthly subscriptions.
The forecasting horizon adapts to your maturity: a 12-month rolling forecast for startups in a rapid growth phase, 24 to 36 months for established companies. The reliability of projections improves by cross-referencing historical retention data with expansion trends by segment.
Favor a conservative approach in your growth estimates. A mature B2B SaaS company aims for a monthly MRR growth rate between 3% and 5%, while a scale-up can reach 10% to 15% during its acceleration phases.
Using MRR for Fundraising
A solid MRR is a powerful argument for investors. B2B startups showing monthly MRR growth of over 15% for 6 consecutive months attract more attention from investment funds.
Presenting MRR to investors requires a precise structure. Highlight the breakdown between your different offers and the progression of the average revenue per customer. A stable conversion rate combined with a regular increase in MRR demonstrates the scalability of your model.
Your pitch gains credibility by presenting the evolution of the LTV/CAC ratio over the last 12 months. A high-performing B2B startup maintains this ratio above 5, proving its ability to generate profitable growth.
Training and Adopting MRR within the Company
Involving Sales Teams
The success of an MRR strategy depends on the active engagement of salespeople. A personalized dashboard allows each seller to visualize their contribution to recurring revenue and stimulates healthy competition.
Holding monthly workshops promotes the sharing of best practices among salespeople — including advanced training on methods like the CRAC method or the CAB method to improve customer retention and upselling skills. For example, an experienced seller can share techniques for turning a one-time contract into an annual subscription.
Individual goals aligned with net MRR enhance team motivation. A Parisian startup transformed its weekly meetings into collective coaching sessions where each salesperson shares their successes in selling upgrades and add-on modules.
Continuous training on new modules and features ensures that your teams maximize every MRR expansion opportunity.
Creating a Data-Driven Culture
Embedding a data-driven mindset begins with demystifying data for every employee. A sales manager at a tech company turned their monthly meeting into a collaborative analysis workshop where teams share their findings based on customer data.
Success comes from empowering teams to leverage data autonomously. An SMB in the software sector introduced weekly "data & coffee" sessions where employees present their analyses and exchange best practices.
Valuing data-based decision-making reinforces this culture. For instance, a SaaS company rewards the initiatives that generated the most measurable impact on customer satisfaction and MRR each quarter.
Frequently asked questions
What is the simple way to calculate MRR (Monthly Recurring Revenue)?
By summing up all recurring revenues planned for the coming period, adjusting for expected churn rate, and adding anticipated revenue from upsells and new client acquisitions.
What is the main difference between MRR and ARR (Annual Recurring Revenue)?
The main traps include over-optimism bias, ignoring seasonality effects, relying on too few data points, and not accounting for pipeline quality versus quantity.
What are the three main ways to positively influence your MRR?
AI and machine learning can analyze historical patterns, detect weak signals in pipeline data, and provide more accurate probability-weighted forecasts than traditional methods.