What is Sales Reporting?
The Fundamentals of Sales Activity Reports
A sales activity report represents the cornerstone of sales management. Its structure rests on three essential components: quantitative data like revenue achieved, qualitative elements such as customer satisfaction, and predictive market analyses.
High-performing companies establish their reports following a precise methodology:
- Centralizing sales data in a unified dashboard
- Comparative analysis of results by sector and by salesperson
- Tracking conversion indicators at each sales cycle stage
The strength of a good report lies in its ability to transform raw data into concrete action levers for the sales force.
The Advantages of Structured Reporting
Structured sales reporting radically transforms sales teams' decision-making. Reliable and updated data enables anticipating market trends and quickly adapting sales strategy.
Increased visibility on performance facilitates identifying improvement areas for each salesperson. Managers can spot best practices and share them within their team, creating collective learning dynamics.
Precise tracking of conversion rates at each stage reveals bottlenecks in the sales process. This detailed analysis enables optimizing resources and time invested in the most promising opportunities. Strategic decisions now rely on facts rather than intuition.
The Importance of Reporting Automation
Sales reporting automation revolutionizes sales teams' daily work. Significant productivity gains materialize through reduced time spent on manual data collection and analysis tasks.
Salespeople instantly access their performance indicators via dynamic dashboards. This increased responsiveness stimulates their ability to seize business opportunities as soon as they arise.
Data reliability improves considerably with elimination of manual entry errors. Teams can now devote their energy to high-value actions like prospecting or negotiation. A salesperson saves an average of 5 hours per week thanks to this activity tracking modernization.
Essential Elements of an Effective Dashboard
Reporting Model Structure
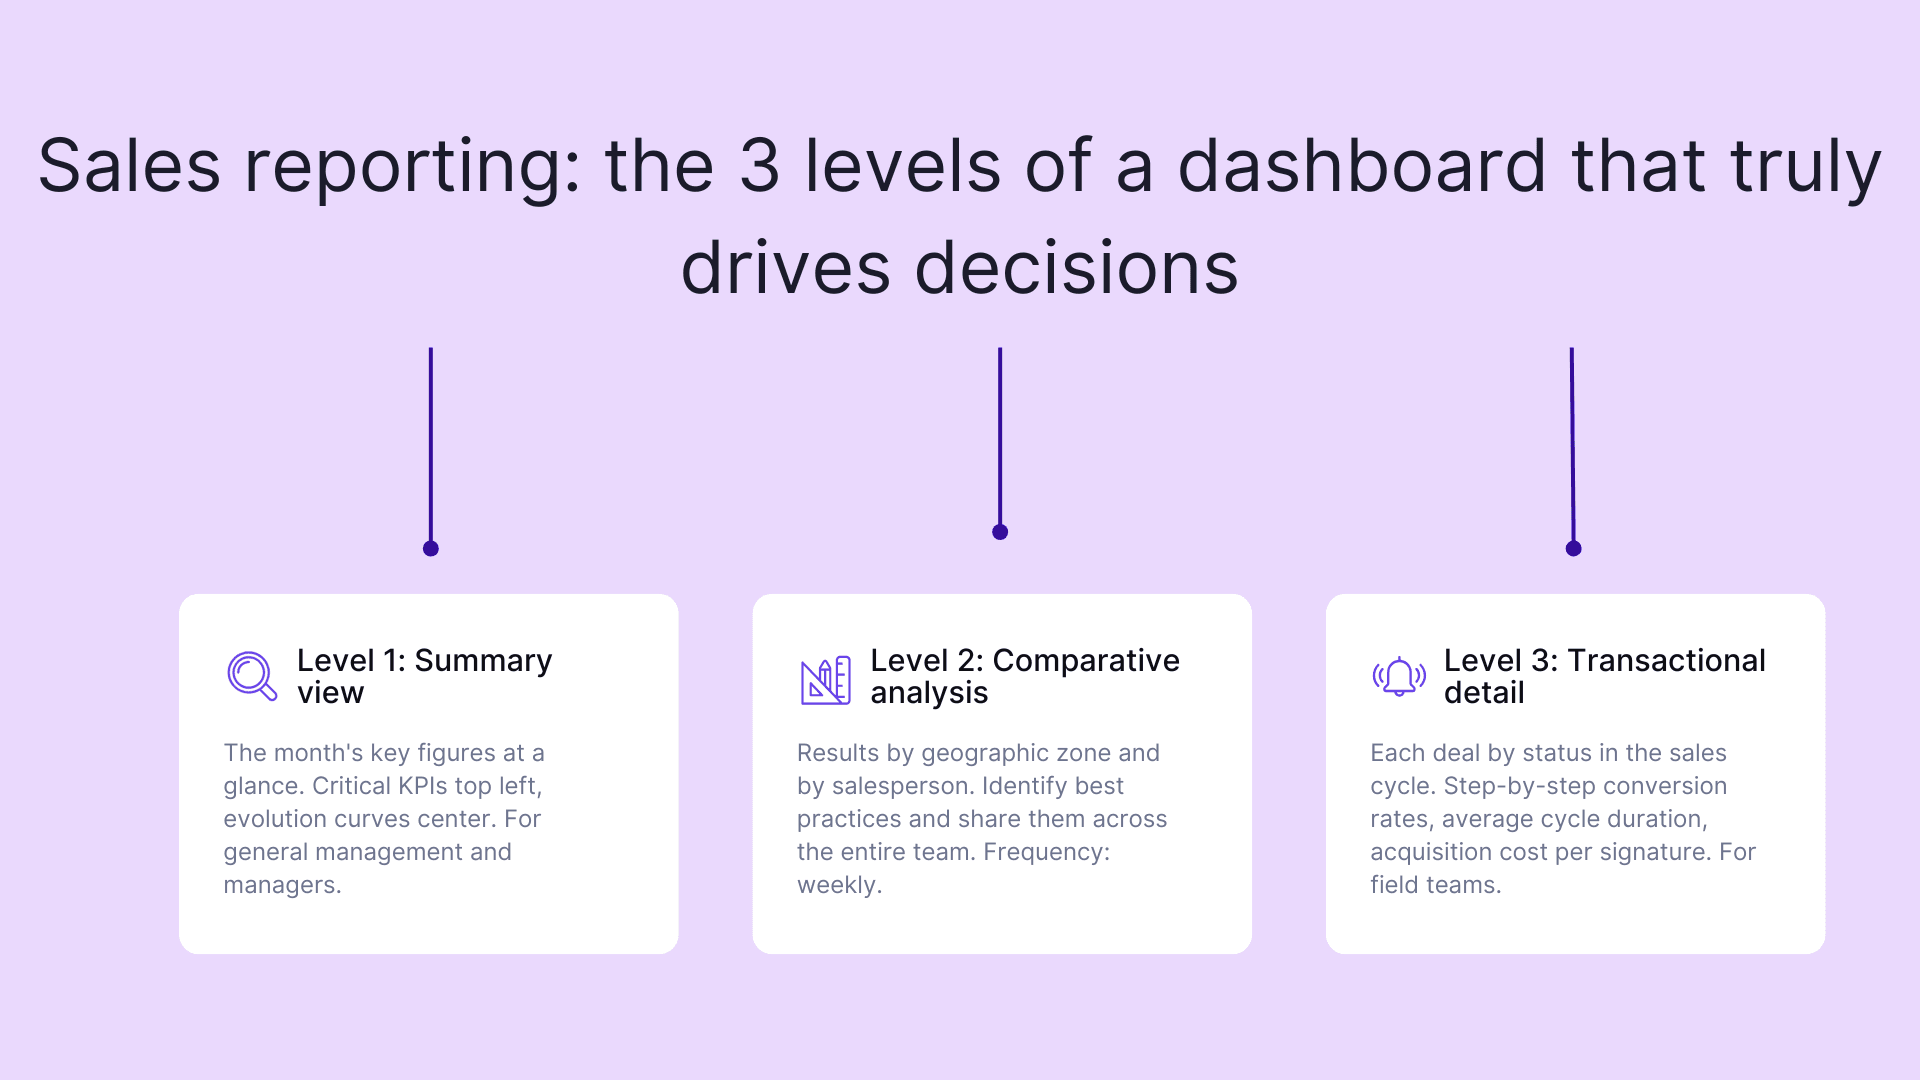
A high-performing reporting model revolves around three analysis levels. The first level presents a summary view with the month's key figures. The second details results by geographic zone and by salesperson, enabling in-depth comparative analysis.
The third level breaks down each transaction by its status in the sales cycle. This pyramidal architecture facilitates navigation between different information layers.
Layout should respect natural reading logic: critical KPIs top left, evolution charts center, and detailed tables bottom. This standardized arrangement accelerates data consultation and interpretation for each user.
Key Performance Indicators to Track
Sales performance measurement relies on precise and measurable indicators. Qualified prospect conversion rate reveals sales process effectiveness, while average basket per customer helps adjust pricing strategy.
Average sales cycle duration enables identifying opportunities to shorten the sales process. Another essential marker: customer acquisition cost, which determines the real profitability of each new signature.
Customer retention rate tracking completes this picture by measuring ability to maintain lasting relationships. For field teams, the ratio of visits transformed into orders serves as a daily efficiency barometer.
These metrics, tracked in a dynamic dashboard, enable precise sales activity management.
Optimal Update Frequency
Data refresh cadence determines your sales management responsiveness. For field activities, daily updates guarantee proactive tracking of ongoing visits and negotiations.
High-stakes opportunities require real-time monitoring via your CRM, while weekly updates suffice for analyzing global market trends. Monthly rhythm better suits strategic reports intended for general management.
A concrete example: a B2B sales team synchronizes its prospecting data each morning, updates its sales pipeline twice weekly, and produces a monthly report for management. This balanced approach maximizes data impact without overwhelming teams.
How to Create High-Performing Sales Reporting
Data Collection Methodology
Successful collection process begins with precise mapping of data sources. Your CRM centralizes client interactions, while your management tools track transactions and sales pipeline.
A modern business intelligence solution automates data aggregation from these different sources. This approach reduces manual error risks and frees time for strategic analysis.
Standardize your input forms to guarantee collected information quality. For example, create structured report templates for client meetings. This standardization facilitates subsequent data exploitation and strengthens your sales analyses' relevance.
Results Analysis Techniques
Mastering analysis techniques transforms your data into winning strategic decisions. A proven method consists of cross-referencing sales performance with sales cycles to reveal key conversion moments.
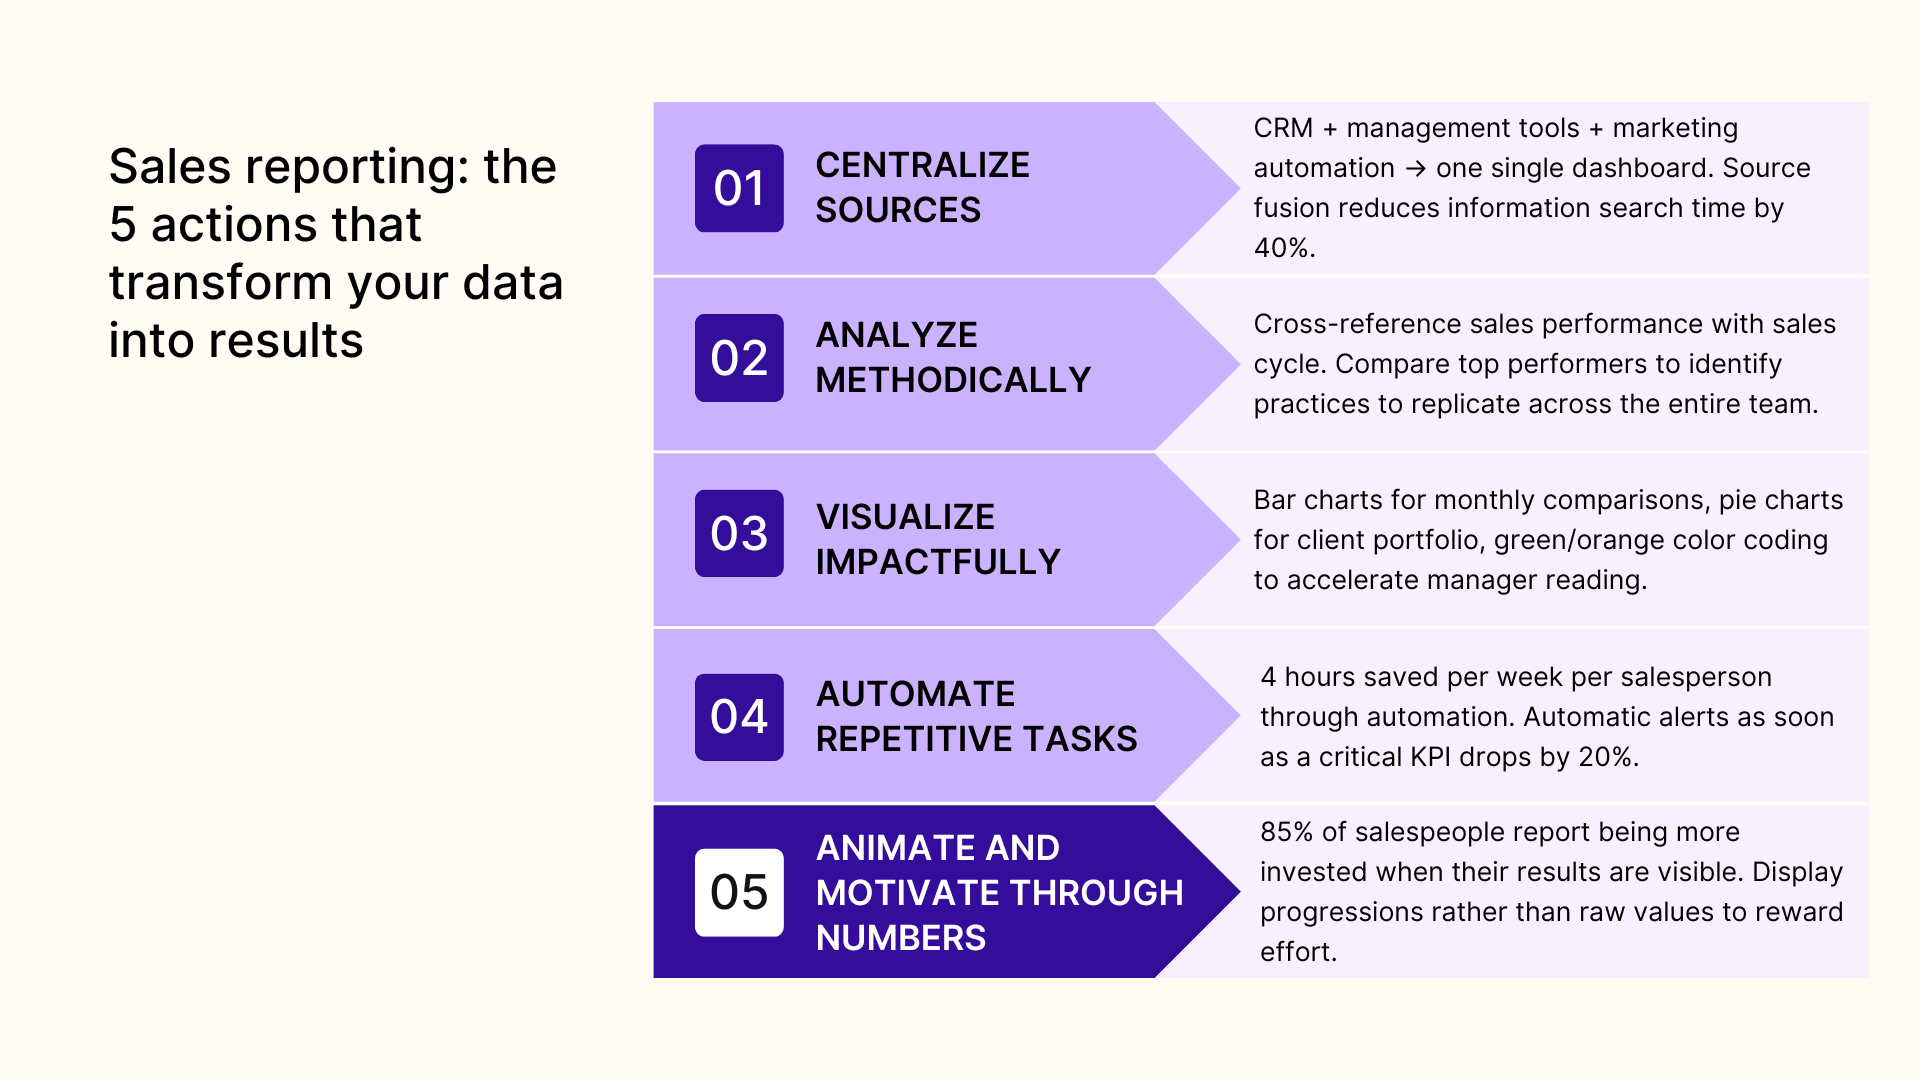
Comparative analysis enables identifying best practices within your sales force. A salesperson converting 30% more than peers in a specific segment becomes a valuable learning source for the entire team.
Evolution curves highlight seasonal trends and hidden opportunities. Visualize your data from different angles: by sector, by product, or by client type. This multidimensional approach unveils unsuspected correlations between your sales actions and their real impacts.
Sales Data Presentation
Effective visualization of sales results requires deep reflection on format adapted to each information type. A bar chart perfectly highlights monthly revenue comparisons, while a pie chart reveals client portfolio distribution.
Summary tables gain impact with intuitive color coding: green for objectives achieved, orange for watch points. This visual approach accelerates understanding for time-pressed managers.
A concrete example: a B2B sales team uses a summary dashboard displaying conversion rates at top, ongoing opportunities center, and action recap bottom. This visual hierarchy naturally guides eyes toward priority information.
Essential Tools for Reporting
Specialized Software Solutions
Modern sales reporting tools revolutionize performance tracking. Power BI stands out for its ability to create interactive dashboards, while cloud solutions enable instant data access from any device.
The new generation of software integrates machine learning to predict sales trends and suggest corrective actions. These advanced features transform sales managers into true strategists, capable of anticipating market developments.
Current platforms simplify report sharing with teams and management. A sales director can now consult essential KPIs on their smartphone, program personalized alerts, and adjust strategy in real-time.
Alternative to Excel for Reporting
A simple spreadsheet no longer meets modern sales reporting requirements. Cloud solutions like Google Sheets offer real-time collaboration and easy data sharing between teams.
Specialized Business Intelligence platforms bring real added value. Their ease of use enables salespeople to create impactful reports without advanced technical skills. A telling example: a salesperson can generate a custom dashboard in a few clicks, versus several hours in Excel.
Current alternatives offer:
- Automatic data updates
- Pre-designed report templates
- Interactive results visualization
- Mobile compatibility for checking figures on the go
Mobile Sales Tracking Applications
Mobility radically transforms sales teams' daily work. A salesperson now accesses their client data, objectives, and performance from their smartphone, even without internet connection.
Mobile reporting makes salespeople more responsive in the field. A representative can enter visit reports immediately after a meeting, check dashboards between clients, or analyze results during commutes.
Modern applications are enriched with advanced features like prospect geolocation, electronic quote signatures, or voice recognition to dictate reports. A salesperson saves an average of 45 minutes daily thanks to these mobility-adapted tools.
Weekly Reporting: Best Practices
Weekly Bulletin Structure
A high-performing weekly bulletin organizes around four strategic sections. The first part summarizes the past week's key figures: sales achieved, conversion rates, and sales pipeline.
The second section highlights major field actions: strategic meetings, proposals sent, and follow-ups completed.
The third component presents gap analysis versus set objectives, accompanied by explanatory factors. The final part outlines the action plan for the coming week, focusing on priority opportunities.
This clear structure facilitates managers' quick reading and guarantees optimal sales performance tracking.
Short-Term Performance Analysis
Daily sales performance analysis requires a methodical and pragmatic approach. A savvy salesperson monitors their key metrics each morning for 15 minutes maximum to quickly identify attention points.
Comparing results over a rolling 7-day period reveals emerging trends and enables anticipating gaps before they become critical. For example, a sudden drop in prospecting email response rate signals an immediate need for message adjustment.
A weekly flash analysis, conducted in 30 minutes on Friday, enables evaluating the ratio between qualified leads and converted opportunities. This practice helps spot bottlenecks in the sales cycle and react without waiting for the monthly report.
Rapid Corrective Actions
Responsiveness to performance gaps requires immediate adjustment measures. A dynamic dashboard enables triggering actions within 24 hours maximum after detecting a results drop.
Here are priority action levers:
- Reallocating resources toward high-potential opportunities
- Strengthening tracking of strategic deals in final phase
- Activating follow-ups on proposals without response for 48 hours
Using automatic alerts on critical KPIs accelerates decision-making. For example, a 20% drop in conversion rate automatically triggers in-depth review of lead qualification process.
Sales Reporting Optimization
Automating Repetitive Tasks
Sales reporting modernization radically transforms sales teams' productivity. A salesperson now devotes their energy to strategic missions rather than time-consuming administrative tasks.
Current solutions automate sales data consolidation, pipeline updates, and activity report generation. This digital transformation frees an average of 4 hours weekly per salesperson, precious time reinvested in client relationships.
Advanced systems automatically synchronize data between CRM and reporting tools. Updates happen in real-time, guaranteeing an always current view of performance. A remarkable efficiency gain enabling teams to focus on value creation and sales objective achievement.
Dashboard Customization
Dashboard customization meets each user profile's specific needs. A marketing manager monitors campaign conversion rates, while a sales director focuses on revenue by segment.
Interface adaptation guarantees quick reading of essential data. Field salespeople favor a summary mobile view, when analysts opt for detailed large-screen charts.
Modern dashboards offer adaptable visual formats: heat maps for analyzing sales zones, waterfall diagrams for tracking negotiations, or progress charts toward objectives. This flexibility strengthens tool adoption by teams and accelerates decision-making.
Multi-Source Data Integration
Intelligent data fusion revolutionizes salespeople's daily work. A salesperson now instantly accesses CRM information, order histories, and marketing interactions from a single interface. This centralization reduces information search time by 40%.
Source unification enriches customer understanding. For example, a salesperson simultaneously visualizes past purchases, marketing campaign responses, and customer service exchanges. This 360° view enables precisely adapting their sales approach.
Modern platforms automatically synchronize email, calendar, and prospecting tool data. This real-time consolidation guarantees sales decisions based on always updated information.
Sales Animation via Reporting
Motivating Teams Through Numbers
Quantified data represents a powerful motivation lever for sales forces. A well-designed dashboard highlights individual and collective successes, creating healthy competition within teams.
Performance highlighting naturally stimulates engagement: 85% of salespeople report being more invested when their results are visible to all. This transparency encourages best practice sharing among colleagues.
To maximize motivational impact, favor displaying progressions rather than raw values. For example, show conversion rate evolution over 3 months or average basket growth versus previous quarter. This approach values efforts made and encourages continuous progress.
Results Communication
Effective sales results sharing requires a communication strategy adapted to each recipient. Managers appreciate executive summaries while marketing seeks detailed analyses of market trends.
Transmission frequency plays a determining role in message impact. Weekly rhythm maintains dynamics without overwhelming teams with information. To maximize engagement, favor impactful visual formats like comparative charts or territorial heat maps.
Using data storytelling transforms raw numbers into captivating narrative. For example, tell the story of sales progression by connecting actions taken to successes obtained. This narrative approach strengthens memorization and information appropriation by your colleagues.
Sales Objectives and Challenges
Defining realistic sales objectives relies on in-depth analysis of current market. Good sales reporting establishes achievable targets: 75% of high-performing teams break down their annual objectives into quarterly milestones.
Alignment between individual challenges and overall strategy guarantees coherent progression. For example, a monthly phone prospecting challenge accompanies precise indicators: number of qualified calls, decision-maker reach rate, meetings obtained.
Dynamic dashboards enable adjusting objectives based on market variations. This flexible approach maintains salespeople's motivation facing daily challenges, while keeping focus on expected results.
2025 Reporting News and Trends
Artificial Intelligence and Prediction
Predictive models transform sales reporting into true anticipation tool. A sales director can now forecast sales cycles with remarkable precision, thanks to algorithms analyzing past buying behaviors.
Machine learning revolutionizes sales opportunity qualification. For example, an AI-based system automatically detects buying signals in client exchanges, enabling salespeople to quickly identify most promising leads.
AI's analytical power also modernizes performance tracking. Predictive dashboards proactively alert on dropout risks in sales pipeline, before traditional indicators even show weakness signs.
New Analysis Methods
Advanced analysis methods redefine modern sales reporting standards. Dynamic data visualization now enables teams to create interactive dashboards adapting in real-time to each user's specific needs.
Behavioral analysis considerably enriches sales cycle understanding. Sales teams now leverage browsing data, interaction histories, and purchase preferences to refine their approach strategy.
New generation dynamic pivot tables facilitate spotting emerging trends. A salesperson can quickly identify promising market segments by cross-referencing sales data with territory socio-economic indicators.
Documentation and Free Resources
The HubSpot digital library offers a complete collection of ready-to-use sales reporting templates. These downloadable tools enable quickly starting your activity tracking.
Power BI free webinars offer in-depth training on creating impactful reports. A program particularly suited to sales managers wanting to modernize their practices.
Also take advantage of educational resources provided by Google Data Studio:
- Automation practical guides
- Industry dashboard templates
- Predictive analysis video tutorials
The "Sales Intelligence Academy" YouTube channel regularly shares expert advice on sales reporting optimization.